- Home
- Publications et statistiques
- Publications
- Wallis and Futuna’s GDP – two estimates ...
Wallis and Futuna’s GDP – two estimates in 15 years (2005 and 2019)
Post No.376. How can we calculate GDP when we lack data? We examine the case of the overseas territories where data is more limited, and particularly that of Wallis and Futuna whose only GDP estimate is for 2005. At the request of local authorities, the IEOM updated this GDP estimate for 2019 within the framework of the CEROM partnership.
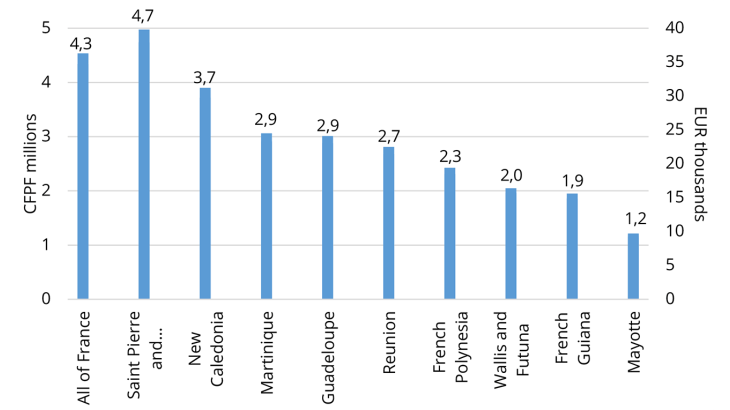
Chart 1: GDP per capita in Overseas France in 2019 euro (right-hand scale) and CFP francs (left-hand scale)

Note: 1 euro = 119.33 CFP (Collectivités Françaises du Pacifique) francs
The CEROM partnership: filling in the gaps in overseas statistics
Unlike mainland France, which has a wide range of indicators enabling it to monitor its economy, Overseas France suffers from a lack of statistical data. This is due to specific features in each territory which limit statistical output. There are numerous examples of gaps: population censuses are only carried out every five years in Mayotte and in the Pacific collectivities, while a consumer price index (CPI) is only calculated quarterly in Saint Pierre and Miquelon and Wallis and Futuna, and not at all for Saint Martin and Saint Barthélemy, etc. However, the most glaring example is the estimate of gross domestic product (GDP), a key indicator for understanding an economy, which is not compiled annually in all French overseas territories.
The Comptes économiques rapides pour l’Outre-mer (CEROM – Fast Economic Accounts for Overseas France) partnership was set up specifically to address these data gaps, and brings together the overseas monetary issuing institutes (IEOM and IEDOM), the French Development Agency (AFD), the French National Institute of Statistics and Economic Studies (INSEE), the New Caledonian Institute of Statistics and Economic Studies (ISEE), and the French Polynesian Institute of Statistics (ISPF). Since 2003, for those territories with sufficient data (i.e. the overseas departments, New Caledonia and French Polynesia), the CEROM has compiled annual GDP estimates in the form of “fast economic accounts”.
However, the smaller territories lack sufficient data. GDP has only been calculated four times for Saint Martin (for 1999, 2010, 2014 and 2021) and three times for Saint Barthélemy (for 1999, 2010 and 2014). Similarly, Saint Pierre and Miquelon’s GDP has only been estimated twice (for 2004 and 2015), while Wallis and Futuna’s only estimate was for 2005, until the IEOM updated it for 2019.
The case of Wallis and Futuna: estimating GDP with very little data
In France, GDP is calculated by compiling national accounts. However, this method cannot be fully replicated in Overseas France as it requires data from a wide range of administrative sources, as well as thematic surveys that are rarely carried out.
In Wallis and Futuna, the main obstacle is an almost complete lack of administrative data on firms and households, as they are not subject, respectively, to corporation or income tax. The calculation of GDP therefore relies on an ad hoc Budget des Familles (Family Budget) survey, which mainly covers households and has only been carried out twice, in 2005 and 2019. This survey is also essential for estimating the amount of food households consume from own production, while more than 80% of households carry out a primary sector activity). In addition, the 2019 survey estimated the amount of so-called “imputed” rents in the national accounts (i.e. the rent that owner-occupiers would have to pay themselves if they were tenants), which is an important statistic since nearly 90% of Wallis and Futuna households are homeowners. The final statistic used to calculate GDP is the monetary expenditure of households. Lastly, the assessment of household monetary expenditure provides the additional data needed for this calculation
For firms, the only statistics available are those derived from their financial accounts. However, not all firms compile detailed accounts, and few were willing to submit them for the IEOM’s 2019 GDP estimate. The sample focused instead on balance sheet data derived from the IEOM’s company rating activities in the Pacific collectivities. The sectoral financial ratios calculated on this basis were then extrapolated to all firms according to their respective headcount. The main limitation of the GDP estimate is therefore the lack of data on firms, and the results for the private sector therefore need to be viewed with caution.
Overall, in 2005 and 2019, although there was insufficient data to compile detailed accounts, such as those produced for mainland France, there was enough to calculate GDP using the three standard national accounting approaches (supply, demand and income), albeit with a few approximations.
Two estimates were also calculated using a benchmarking approach. The first consisted in an econometric adjustment linking imports per capita to GDP per capita in the Pacific territories, the results of which were then applied to Wallis and Futuna. The second relied on the long-term ratio between the quantity of money in circulation and the general price level, in accordance with the quantity theory of money. Wallis and Futuna’s GDP was thus estimated based on the average speed of circulation of money in the Pacific territories, which was assumed to be exogenous. While the results of these two approaches can be considered less reliable as they are based on strong assumptions, they do appear to validate the results of the quasi-accounting approach.
From 2005 to 2019: strong economic dependence on the public sector
In 2019, Wallis and Futuna’s real GDP, in current CFP francs, was estimated at CFPF 22.6 billion (some EUR 189.4 billion), up from CFPF 18 billion in 2005. With a population of 11,558, GDP per capita came out at close to CFPF 2 million (EUR 16,400), which is around 45% of the level in mainland France. In 2005, it amounted to CFPF 1.2 million or EUR 10,000 per capita, equivalent to 37% of the level in mainland France.
Wallis and Futuna is therefore below the median for the French overseas territories, with GDP per capita just below French Polynesia’s (CFPF 2.3 million or some EUR 19,300) and just above French Guiana’s (CFPF 1.9 million or EUR 15,633). However, this comparison fails to take account of differences between territories in the general price level, and needs to be treated with caution.
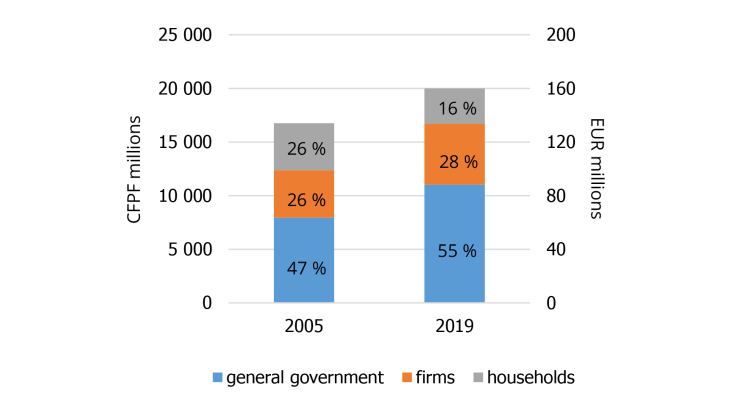
The rise in GDP between 2005 and 2019 is primarily attributable to the public sector, which is the main pillar of the economy (55% of value added). As the archipelago’s biggest employer (66% of declared jobs), the salaries it pays its workers help to boost consumption, while public investment is the main driver of construction and public works activity. Conversely, the share of value added created by households has shrunk from 26% to 16%. It essentially comprises own food production and owner-occupier rents. However, own food consumption has fallen, with households shifting more to the consumption of purchased food, and this trend has notably benefited the wholesale and retail trade sector. This has helped to drive up private sector wealth creation, but the latter still accounts for barely a quarter of total value added, as in 2005. Over the longer term, questions can be raised as to whether this growth model, driven primarily by public consumption, is sustainable, especially given the sharp population drop (-3.5% between 2018 and 2023) caused by mass emigration.
Chart 2: Distribution of value added in 2005 and 2019

Download the PDF version of the publication
Updated on the 3rd of December 2024