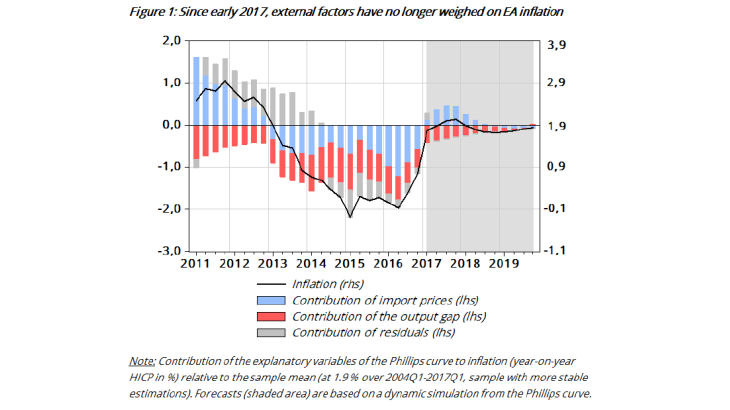
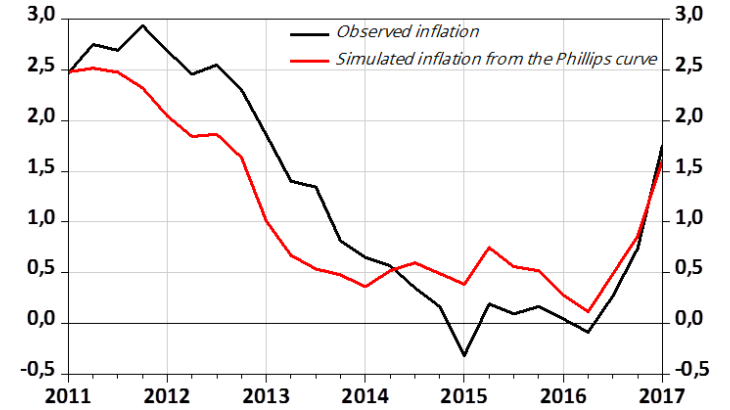
Note: Dynamic simulation of the Phillips curve over the sample (Q1 2004-Q1 2017) compared with observed inflation (HICP year-on-year percentage change). In the simulation, past inflation takes its predicted value at the previous date, import prices take their observed value and the output gap comes from the last estimate of the European Commission.
Figure 2 nonetheless shows some differences between simulated inflation and observed inflation: the model tends to underestimate inflation between 2011 and 2014 and to overestimate it thereafter. There are several possible explanations for this: the omission of factors which have an impact on inflation in this relatively simple model; problems related to the estimation of the output gap; or a possible change in the sensitivity of inflation to one of the explanatory variables of the Phillips curve, notably the output gap. This last point has recently attracted renewed interest in the literature (see, for example, Ciccarelli and Osbat, 2017, or Oinonen and Paloviita, 2014). However, our estimation based on 8-year rolling windows does not reveal any significant change in the relationship between inflation and economic activity in recent years (see Rue de la Banque No. 37).
Historical contribution of factors
Using the Phillips curve, we calculate the contributions of import prices and the output gap to inflation measured as the deviation from its sample mean (which is equal to 1.9% over Q1 2004-Q1 2017). Figure 1 shows that import prices and sluggish economic activity contributed roughly equally to low inflation in the euro area between 2013 and 2016. Import prices had their strongest negative impact (i.e. -1.2 pp) at the beginning of 2016, when oil prices fell sharply (in year-on-year terms). Since then, import prices have started to recover, exerting less and less downward pressure on inflation.
As a result, import prices contributed 0.7 pp to the increase in the inflation rate, measured as the deviation from its mean, between Q4 2016 and Q1 2017. The recovery in economic activity has been more gradual, with the output gap declining from -3% at the end of 2013 to -1% at the end of 2016, and this too has progressively reduced the downward pressure on inflation. Nonetheless, the output gap is continuing to weigh negatively on inflation as a deviation from its mean, pushing it down by about -0.4 pp in Q1 2017.
Contribution of factors in 2017 and outlook for inflation
In 2017, import prices (relative to the GDP deflator) are expected to continue to increase sharply, thanks also to favourable base effects, and this should lend strong support to short-term inflation (see Figure 1, shaded area).
From 2018 onwards, and assuming broadly stable oil prices beyond this date, import prices should grow at a slower rate, comparable to that of the GDP deflator. As a result, they should no longer contribute positively to inflation, which is expected to fall slightly relative to 2017. On the other hand, the output gap should continue to close in the coming years, absorbing the remaining excess capacity in the economy until 2018 and turning slightly positive thereafter. This should have a more lasting positive effect on inflation through to the end of 2019.
Under these assumptions, the model predicts an annual inflation rate of 1.8% in 2019, which is close to the latest macroeconomic projections for the EA established by ECB staff and published in March 2017 (ECB, 2017).

