- Home
- Publications et statistiques
- Publications
- Monthly Business Survey – Start of Augus...
The Banque de France publishes a range of monthly and quarterly economic surveys that provide a snapshot of the French economy in the form of business climate indicators and short-term forecasts.
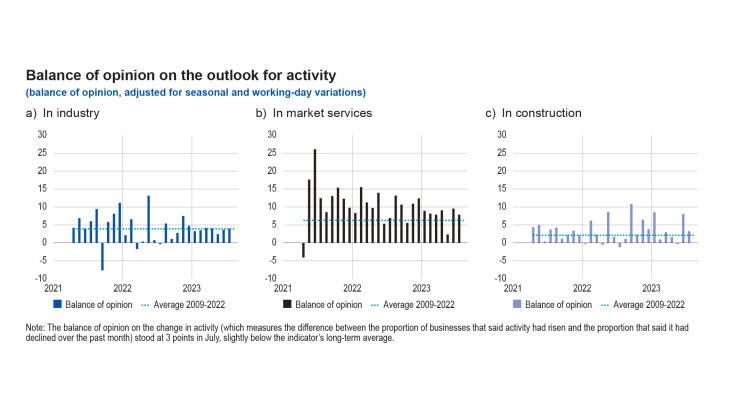
According to the business leaders surveyed (approximately 8,500 companies and establishments between 21 July and 4 August) activity rose in July in industry, services and construction, and the slowdown was less pronounced than expected last month.
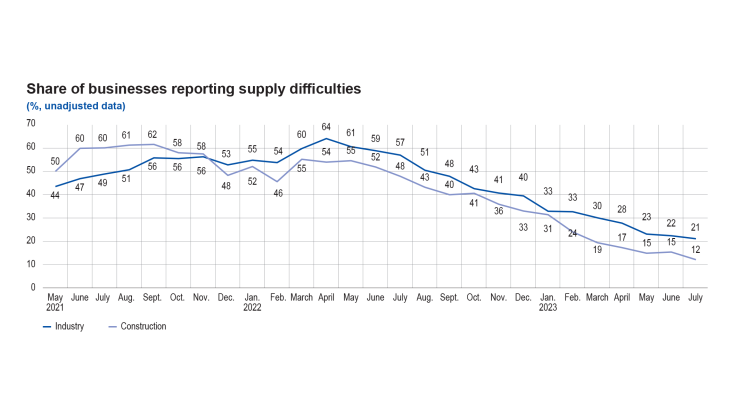
Supply difficulties eased further in July in construction (12% of firms reported difficulties in July after 15% in June) and in industry (21% against 22%). For the fourth month in a row, business leaders reported a sharp fall in raw material prices, and a stabilisation of finished goods prices. The balance of opinion on services and construction prices returned to pre-Covid levels. In industry, only 9% of business leaders stated that they had increased their selling prices in July, and 6% had lowered them. In construction, the share of companies that lowered their prices was stable compared with June. Recruitment difficulties increased slightly, affecting half of all companies (52%).
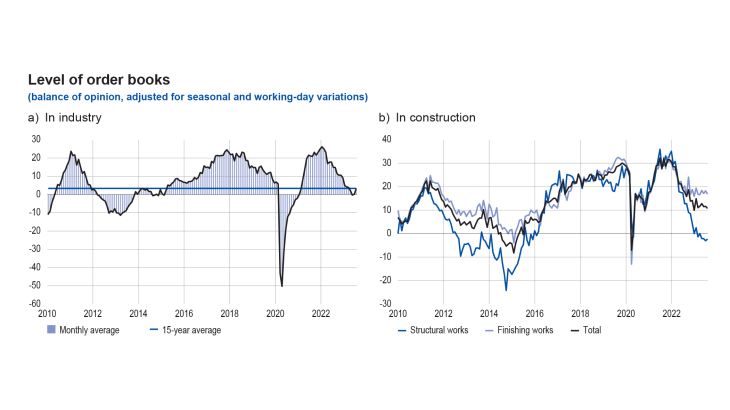
Our uncertainty indicator fell in industry, services and construction. In industry and construction, order books remained below their long-term averages. The cash position continued to be weak in industry and services.
Based on the carry-over at the end of June and the results of the survey, supplemented by other indicators, we estimate that GDP growth in the third quarter of 2023 will be slightly up on the previous quarter.
1. In July, activity strengthened in industry, services and construction
In July, industrial activity grew at a rate that was still below the indicator’s long-term average, but slightly faster than companies had expected at the beginning of last month. The balance of opinion suggests a significant rise in production in the wearing apparel-textiles-footwear, wood-paper-printing, computer, electronic and optical products, and automotive sector. By contrast, activity declined in pharmaceuticals, rubber-plastics and chemicals.
The succession of shocks since the start of 2022 has particularly affected certain sectors. While the capacity utilisation rate (CUR) fell by 2 percentage points overall in the manufacturing industry (77% in June 2023 compared with 79% in January 2022), some sectors recorded sharper declines: chemicals (-8 percentage points), woodpaper-printing (-8 percentage points), rubber and plastic products (-6 percentage points) and pharmaceuticals (-5 percentage points). Conversely, the easing of supply constraints contributed to a rise in the CUR in the automotive sector (10 percentage points since January 2022 to 75%) and computer, electronic and optical products (5 percentage points).
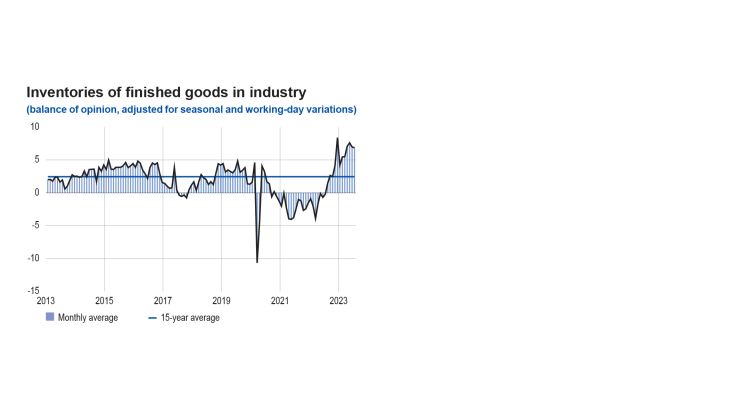
Inventories of finished goods remained at a high level in July, with contrasting trends across sectors: they rose in aerospace and chemicals, but contracted in the automotive and machinery and equipment sectors.
In the market services sector, activity remained buoyant, again beating business leaders’ expectations of last month. Growth was seen in most service activities, except for personal services and temporary work.
Activity in the construction sector rose slightly, especially in the finishing works sector.
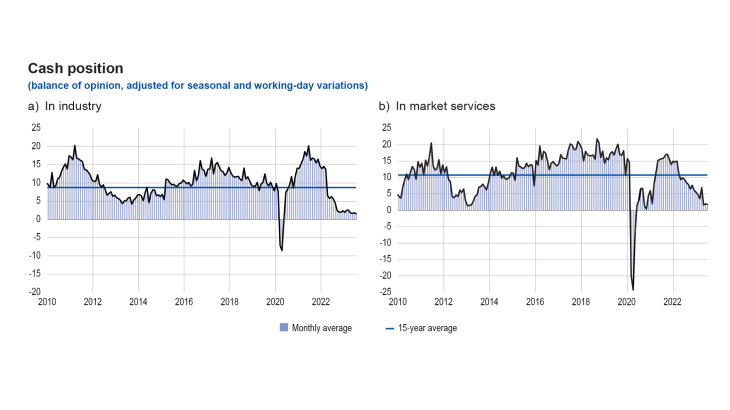
The balance of opinion on the cash position stabilised in industry, due to the continued easing of energy and raw material prices; however, it remained below its long-term average. There was little change in the cash position in services in July, and it was well below its long-term average, particularly in business services.
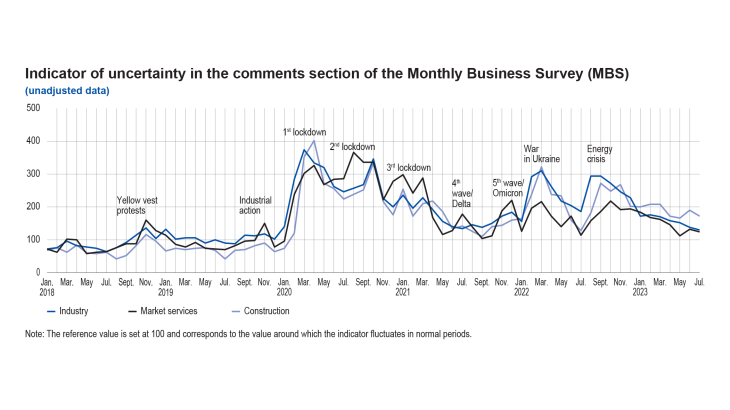
Our monthly uncertainty indicator, constructed from the text mining of surveyed companies’ comments, declined across all sectors. In industry and services, it tended to move towards the pre-covid level, but remained higher in construction.
The balance of opinion on order books in industry improved slightly in July. In construction, order books contracted slightly. In construction, the deterioration in order books since mid-2022 has mainly been attributable to structural works which have been hit by the sharp drop in sales of new single-family houses; conversely orders books in finishing works have been stable since last autumn, at a level that remains above their long-term average.
2. Supply difficulties have become less frequent, with the pace of price rises returning to pre-covid levels
In July, supply difficulties eased again in industry (affecting 21% of businesses after 22%) and in construction (12% after 15%).
The balance of opinion on raw material prices points to a continued fall in industry, for the fourth month in a row, albeit at a more moderate pace this month. The slowdown in the rise in finished goods prices continued this month, with the balance of opinion tending to stabilise in industry and services. In construction, prices slowed again. In all three major sectors, therefore, prices rose at a rate comparable to that of the pre-Covid period.
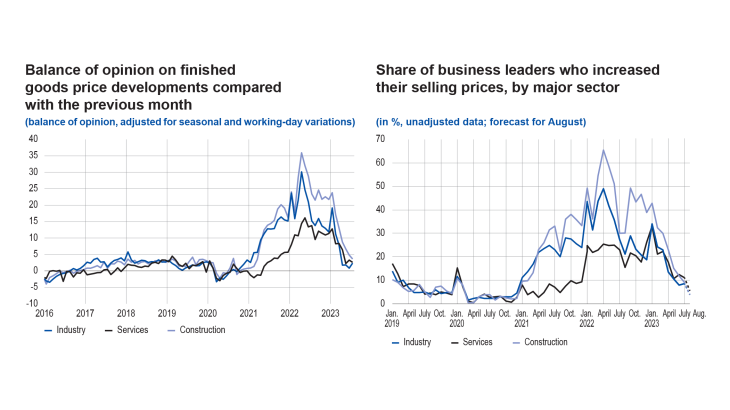
More specifically, 9% of business leaders in industry reported that they had raised their selling prices this month, compared with 8% the previous month and 27% in July 2022. Moreover, 6% of business leaders said that they lowered their selling prices in July, in line with the easing of raw material prices; by comparison, this proportion was around 3% during the pre-Covid period (2017-19), and had fallen to almost 1% a year ago. Finished goods prices declined the most in chemicals, wood-paper-printing, metal and rubber-plastic products.
In construction, 9% of companies increased their selling prices this month (compared with 12% the previous month, and 30% in July 2022), while 3% of companies reported price cuts, compared with less than 1% on average between mid-2021 and the end of 2022.
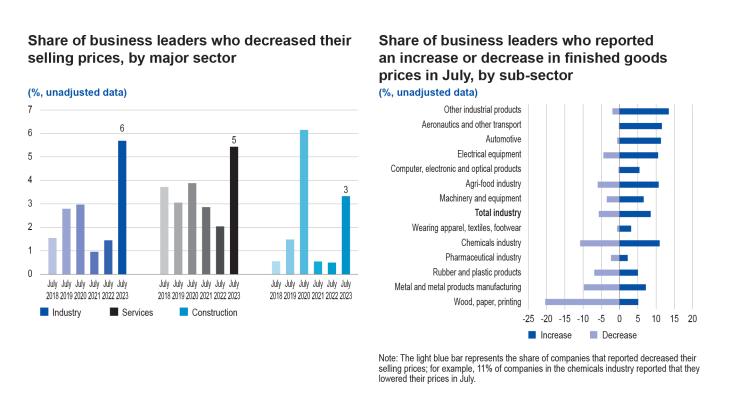
In services, 11% of companies reported a rise in their selling prices, compared with 12% last month and 23% a year ago.
The share of business leaders planning to raise their prices in August continued to fall in industry (4%), market services (5%) and construction (4%).
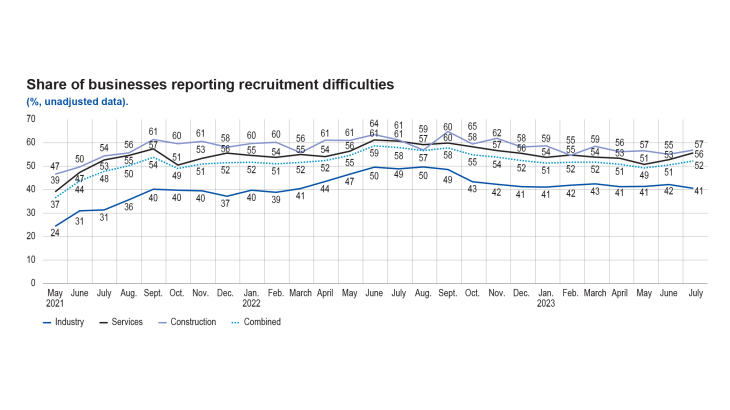
Business leaders were also asked about their recruitment difficulties. These difficulties increased slightly in July, affecting 52% of companies surveyed across all sectors, compared with 51% in June.
3. Our estimates suggest a rise in activity in July
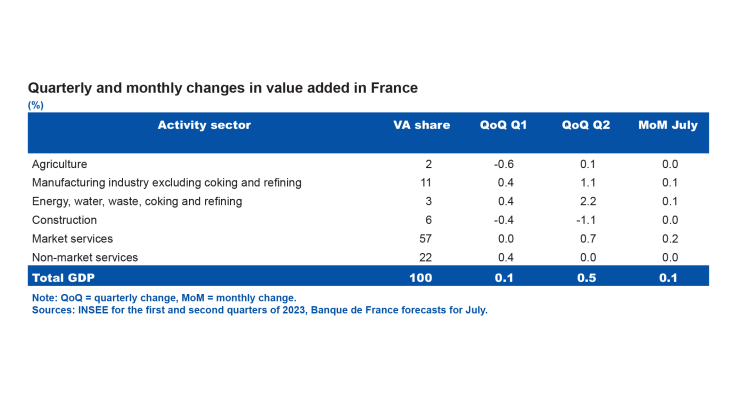
The quarterly accounts published by INSEE at the end of July showed a rise of 0.5% in activity in the second quarter compared with the previous quarter. Despite a further downturn in the construction sector, activity was buoyant over the past quarter in both industry and market services. Temporary factors that supported activity in the second quarter are not expected to underpin growth further in the third quarter, but they should not lead to a mechanical correction in activity this quarter.
For July, based on granular information from the survey and other available data (INSEE and high frequency data), our estimates point to a slight increase in GDP compared with June. This increase in activity is expected in industry and market services, while construction should remain stable.
More specifically, according to the survey data, in July, value added was up in the agri-food and transport equipment sectors. Value added in the services covered by the survey also appears to have risen, in both accommodation and food services and business services, but to have declined in services to households.
According to the high-frequency data that we additionally monitor for service sectors excluded from, or only partially covered by, the survey, transport services and retail trade appeared to have grown.
For the third quarter, based on the carry-over at the end of June, survey data for July and other indicators, GDP is expected to be slightly up on the previous quarter. After the positive surprise in the second quarter, which raised the growth carry-over to 0.8% for 2023, our estimate for the third quarter is now broadly in line with the GDP trend forecast in our medium term macroeconomic projections published in June.
1 Due to the uncertainty surrounding the reliability of certain responses and their statistical treatment, some business leaders’ expectations for August are not included in this month’s document.
Download the paper
Updated on the 25th of July 2024