Eco Notepad

Monetary policy and liquidity concentration in the euro area

Published on 20 November 2018
Authors : Vincent Grossmann-Wirth, Benoît Hallinger

Post n°93. The Eurosystem’s non-standard monetary policy has led to a significant build-up of excess liquidity in the euro area banking system, concentrated among a few countries. Since 2015, this concentration can mainly be explained by the Eurosystem’s asset purchase programme (APP) and the geographical location of the accounts and settlement circuits used in its implementation.


Image Chart 1: High concentration of excess liquidity among a few countries Sources: ECB, Banque de France
Chart 1: High concentration of excess liquidity among a few countries Sources: ECB, Banque de France

Note: excess liquidity per country is the sum of the current accounts and outstandings deposited by commercial banks at their respective central banks.

Excess liquidity is defined as the amount of liquidity provided by the central bank over and above the strict needs of commercial banks. In the euro area, it corresponds to the funds held by banks with the Eurosystem, either on their current account (excess reserves) or via the deposit facility. Before the financial crisis, the Eurosystem met almost exactly the liquidity needs of euro area banks, via refinancing operations conducted as competitive tender procedures. Once injected into the system, liquidity is redistributed among banks according to their needs (to make payments or cover their reserve requirements) via the interbank market. As a result, at any given time, the liquidity distribution may differ from the initial allotments. 

Since the implementation of non-standard measures, large amounts of excess liquidity (almost EUR 1.9 trillion at end-October 2018) have accumulated, mainly in a few countries: Germany, France, the Netherlands, Finland and Luxembourg. This liquidity distribution, which is presented in a recent ECB working paper to which the Banque de France contributed, was the result of a number of successive phenomena.

2008-2012:  interbank market stress and risk aversion

During this period marked by the financial crisis of 2008-2012, excess liquidity was mainly the result of the sharp increase in commercial banks’ demand for refinancing, met by the Eurosystem via refinancing operations at full allotment. The extension of the maturity of these operations to up to three years in 2011 also contributed to increasing the amount of excess liquidity, which reached almost EUR 1 trillion in 2012.

Image Chart 2: High take-up by Spanish and Italian banks in refinancing operations Sources: ECB, Banque de France
Chart 2: High take-up by Spanish and Italian banks in refinancing operations Sources: ECB, Banque de France

Note: central bank refinancing of Italian and Spanish commercial banks, compared with Eurosystem refinancing as a whole and excess liquidity

During this period, the bulk of liquidity was provided by the Eurosystem to the banks of the countries most exposed to financial stress (Spain and Italy in particular, see Chart 2). However, in the context of an interbank market freeze (sharp increase in risk perception among banks) and a flight-to-quality phenomenon (investors' preference for the safest assets, particularly in "core” countries), liquidity built up in the banking systems of a few countries only. This was particularly the case in Germany, the Netherlands, France, Finland and Luxembourg, which together accounted for over 80% of the excess liquidity as of 2009.

As of 2015: mainly due to the Eurosystem's asset purchase programme (APP)

While excess liquidity declined sharply after 2012, in line with the easing of financial strains, it started to accumulate again, for very different reasons, as of March 2015 (see Chart 1), following the launch of the expanded APP. In this instance, excess liquidity resulted mechanically from measures taken by the Eurosystem and did not reflect increased financial stress.

The new targeted longer-term refinancing operations (TLTROs), with a maturity of four years, also led to an increase in excess liquidity. Yet, the massive liquidity injection carried out by the ECB under the APP was the main reason why excess liquidity rose as of 2015.

With the decline in financial stress and risk aversion, liquidity should have been distributed in a more homogeneous manner, in line with the ECB capital key, which determines the allocation of the Eurosystem’s asset purchases among issuing countries. However, as shown in Chart 1, this redistribution of liquidity did not take place and it has remained concentrated in five countries.

The first reason is the fact that sovereign yields remained relatively high in countries such as Italy, Spain or Portugal, which may have encouraged banks in these countries to invest in such securities, rather than deposit their liquidity at a lower interest rate with the central bank. As the yields on these countries’ sovereign bonds declined, this opportunity disappeared, leading to a shift in banks' investments towards higher yielding assets, issued largely outside the euro area (hence a trend increase in liquidity flows to the financial centres of the "core" countries - see below).

Influence of the geographical location of the accounts of Eurosystem counterparties

The second, more structural reason concerns the liquidity flows generated by Eurosystem purchases conducted with counterparties outside the euro area, whose settlement accounts are largely concentrated in the financial centres of a few euro area countries.

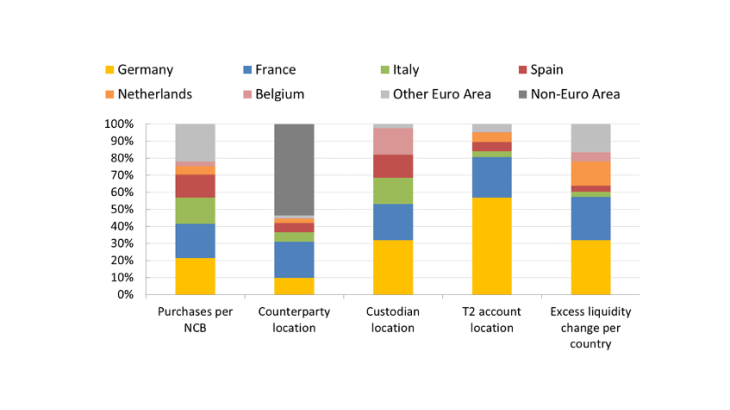
Chart 3 shows that the APP generated significant liquidity flows to accounts in Germany and, to a lesser extent, in France. Liquidity then seems to have been concentrated in a small number of countries, in particular the Netherlands. Luxembourg is, for its part, a major financial centre, home to numerous asset management firms. As regards Finland, it notably hosts the accounts of non-euro area Scandinavian institutions. This confirms that after 2015, the concentration of liquidity flows among a small number of “core” countries was not due to renewed risk aversion but rather to the choices of the main Eurosystem counterparties.
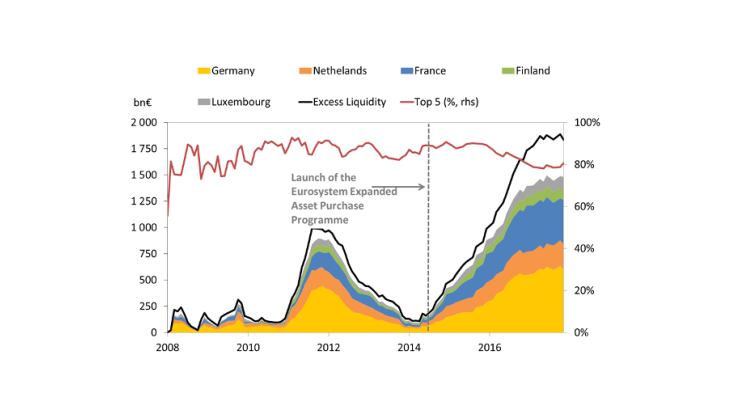
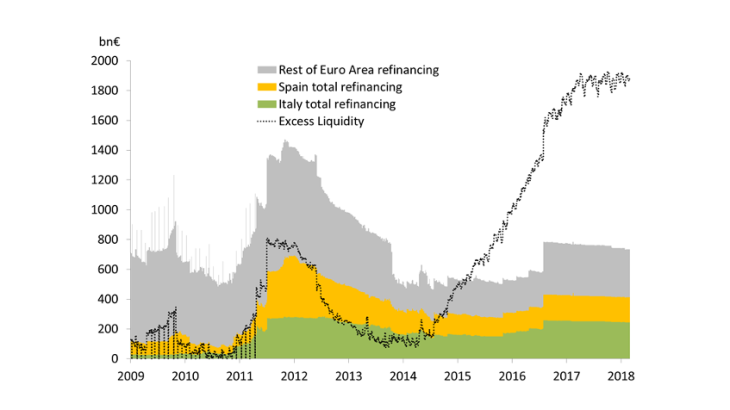
Image Chart 3: APP money per jurisdiction – from purchase to excess liquidity holding Sources: ECB (2017)
Chart 3: APP money per jurisdiction – from purchase to excess liquidity holding Sources: ECB (2017)

Note: breakdown, stage by stage, of the liquidity injected in 2015-2016 into the various national banking systems by the APP, according to the location of the different intermediary accounts.

Liquidity distribution and changes in TARGET2 balances

Since they generate cross-border payments, these liquidity flows are mechanically recorded in TARGET2 balances. These represent the claims and liabilities of euro area national central banks vis-à-vis the ECB. By identifying the mechanisms behind the distribution of liquidity in the euro area, we can thus confirm that changes in TARGET2 balances as of 2015 were of a very different nature from those of the 2008-2012 period. They mainly stemmed from an interaction between two factors: the Eurosystem’s APP and the geographical location of the accounts and settlement circuits used by financial institutions.