- Home
- Publications et statistiques
- Publications
- Markets normalising in 2023 following ep...
Post n°318. 2022 was marked by significant market corrections against a backdrop of geopolitical tensions and monetary policy normalisation. While the financial system has absorbed these shocks well, localised episodes of stress have highlighted certain vulnerabilities. The Banque de France's market stress indicator tracks the origin and changes in market tensions.

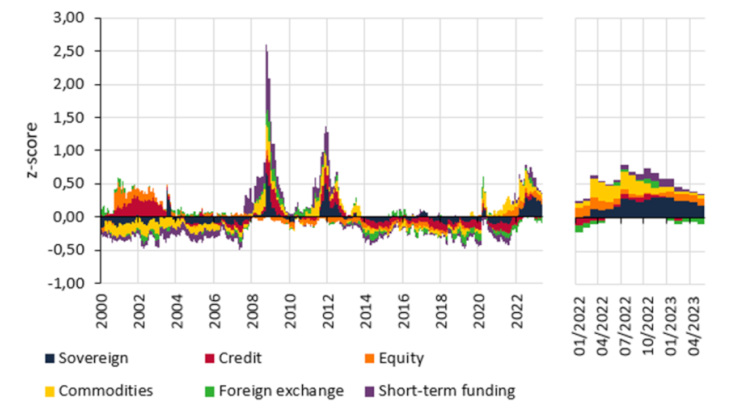
Note: the z-score composite indicator of market stress represents the average of the market z-scores (sovereign, credit, equities, foreign exchange, commodities and short-term funding).
The market stress indicator, developed by the Banque de France as part of its role of monitoring financial risks and vulnerabilities, serves three purposes: i) it provides a clear signal in almost real time of the emergence of tensions, ii) it puts them into a historical context, iii) it assesses the normalisation of the markets. This composite indicator is calculated monthly from 32 sub-indicators.
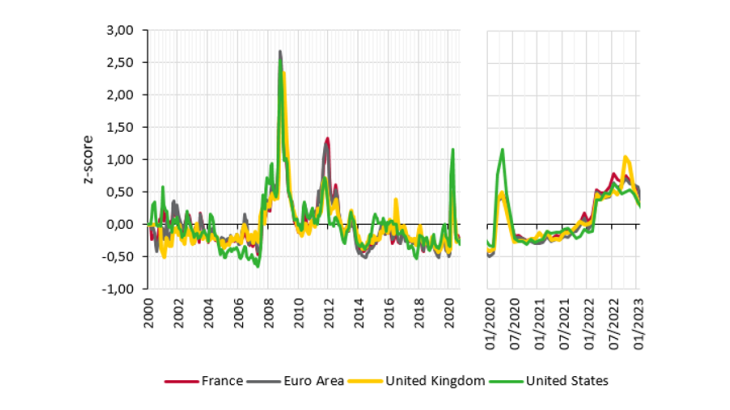
It identifies levels of tension on international markets such as those seen in 2020 at the peak of the Covid-19 epidemic. While the 2020 market stress episode was sudden and temporary, tensions remained at historically high levels throughout 2022.
A cross-cutting measure of market stress using a statistical signal extraction method
The composite market stress indicator tracks developments in six market categories and is broken down by geographical area, making it possible to identify the contributions of each category and region to global stress. It is based on a set of indicators that provide information on the state of tensions, in particular forward-looking indicators derived from implied prices or volatilities of derivatives, which are used to monitor market expectations. For example, tensions resulting from the financing conditions of non-financial players are listed in the "Credit" market category, which includes data on credit default swap (CDS) spreads, credit risk premiums and the shape of the risk premium curve by credit rating. Each category is made up of 4 to 8 normalised indicators based on at least 15 years of historical data.
Using a historical and geographical approach, it is possible to assess how quickly and to what extent markets return to normal following a shock. A value above/below 0 indicates a stress level above/below the historical average.
This indicator identified the stress episodes of 2008 (exceptionally high levels in all geographical areas following the collapse of Lehman Brothers) and 2012 (stress more particularly concentrated in Europe).
Market tensions fuelled by the volatility of interest rates and energy prices
Russia's invasion of Ukraine increased the level of tension on commodity markets (see Chart 2), particularly on energy markets, where prices and volatility had already been rising since the end of 2021. This led to a deterioration in the overall macroeconomic environment, exacerbating pre-existing inflationary pressures and dampening growth forecasts. This new short-term inflation regime accelerated the pace of monetary policy normalisation, which was a determining factor in market trends in 2022. Sovereign debt markets came under severe pressure as of March 2022 due to increased volatility across the yield curve, particularly at the short end, amid uncertainty over the pace of interest rate rises by the major central banks. Equity and credit markets also underwent significant corrections and saw an increase in volatility, even though these categories contributed more moderately to the global stress indicator.
Financial and non-financial players were faced with a sharp increase in margin calls on derivatives and repo products on the most volatile markets (interest rates, energy, etc.). The energy market shock increased the need for liquidity to meet margin calls on derivative positions. Since the end of September 2022, these liquidity tensions have fed into the repo markets, which were already suffering from a scarcity of collateral (see short-term funding in Chart 2).
While the financial system proved resilient to renewed market tensions, the weakest players nevertheless came under pressure, in particular the non-bank financial intermediaries most exposed to leverage and liquidity risks.

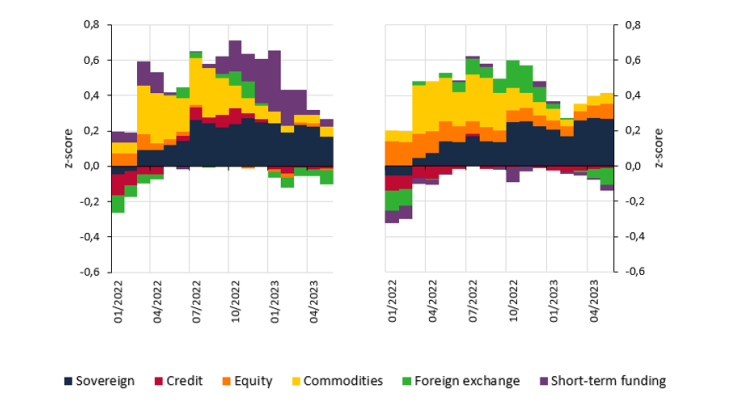
Note: contributions to market stress
Global stress followed by market normalisation in different geographical areas
The market stress indicator shows the strong international synchronisation of market tensions as well as the factors specific to each jurisdiction.
Rising inflation and interest rates, in the wake of the post-Covid recovery and the Russian invasion of Ukraine, have had a major impact on all global markets, leading to a concomitant increase in global stress in the various regions monitored, to levels close to those of March 2020 (see Chart 1). This contagion effect began to subside slightly as of July 2022, due to the more marked divergence in the inflation paths of the different countries, particularly the United Kingdom and the United States.
The rise in the UK composite indicator chiefly reflects tensions over sovereign debt in autumn 2022 (see Chart 1), fuelled by massive sales of sovereign securities by UK pension funds, which are exposed to significant margin calls because of their highly leveraged positions. These shocks did not spill over to other regions.
In the United States, the slowdown in inflation led to a downward revision of short-term interest rate expectations. These changes in expectations helped to limit tensions on the US repo market. While the difference in stress levels between Europe and the United States narrowed as a result of the crisis in Ukraine, it increased again in August, returning to the levels seen at the end of 2021. The more attractive US interest rates helped fuel volatility on foreign exchange markets. Sovereign debt markets showed high levels of stress, against a backdrop of deteriorating liquidity conditions associated with high volatility and rising transaction costs.
Since October 2022, the stress indicator has been suggesting a gradual normalisation of financial markets. At the beginning of May, it fell to half its October 2022 level (see Chart 1), in both Europe and the United States. While repo market stress scenarios still diverge significantly between the United States and Europe, the tensions of 2022, resulting in particular from the scarcity of collateral, have eased considerably since the beginning of 2023. Lastly, it is worth noting that the indicator is not intended to be predictive and does not forecast market trends for 2023. It does, however, provide useful insights for monitoring tensions and their normalisation, particularly in turbulent times such as seen in 2022.

Updated on the 25th of July 2024