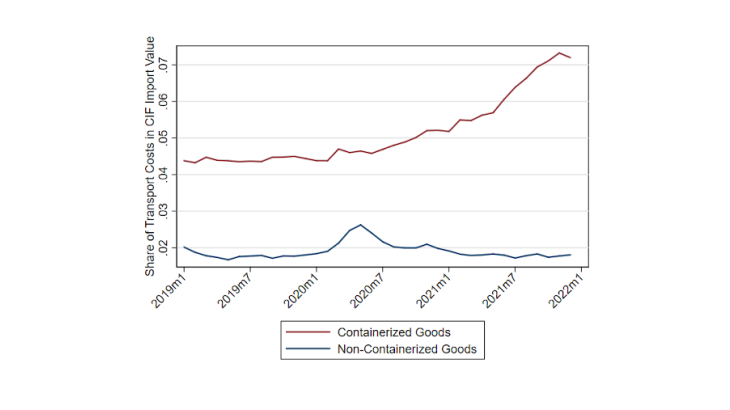
Note: Share of transportation costs in total CIF import value, computed as one minus the ratio of fob imports over CIF imports. Containerised goods are goods for which more than half of their 2019 imports arrived via containerised vessels. Reading aid: since the start of the pandemic, the share of transport costs has almost doubled for containerised goods (red line from 4.4% to 7.2%).
Since the second half of 2020, there has been a rapid surge in the cost of shipping goods across borders. Leading indicators suggest an increase in these costs of 300-500% between late 2020 and early 2022. To what extent has this increase in international shipping costs fuelled import prices? Any increase in shipping costs would not show up in the official import price inflation published by the Bureau of Labor Statistics (BLS), since prices underlying the BLS calculation are “free on board” (FOB) prices, which exclude international transport costs. This raises the question of whether the inflation experienced by US importers has actually been substantially larger than what is suggested by BLS numbers.
Using trade data to measure import price inflation
We use detailed US import data to measure import price inflation. These data have the advantage (e.g. over EU trade data) of having two values recorded for each transaction: a value including international transport costs (“cost, insurance and freight” or CIF), and a value excluding these costs (FOB). We can then construct two aggregate import price inflation rates, with the difference between these rates informing us about the increase in import prices due to rising transport costs.
The data on US imports are detailed by month, type of product (over 15,000) and origin country (over 200). For each month, product and origin country, we extract data on imported value (in USD) and quantity (for instance, the number of items). Unit values are then obtained by dividing the imported value by the total quantity imported.
Compared to BLS prices, which are prices of clearly identified products (such as a Samsung 800 watt microwave with a capacity of 22 litres), unit values are weighted average prices of all imported products within a narrowly defined category (such as microwave ovens with a capacity of less than 22.5 litres). Changes in unit values over time can then come from changes in the prices of individual goods, or from changes in the composition of goods within the category: if we increase imports of a more expensive microwave and reduce imports of a cheaper microwave, the unit value will go up even though the prices of individual items have not changed. While this problem cannot be completely resolved, we mitigate it by computing unit values at the finest level possible, that is, for each combination of a ten-digit trade code and a country of origin (called a “variety”). An example of a variety would be microwave ovens with a capacity of less than 22.5 litres imported from Malaysia. At this fine level, changes in unit values over time likely carry a lot of information about price changes.
The effect of rising transport costs on aggregate import prices has been modest…
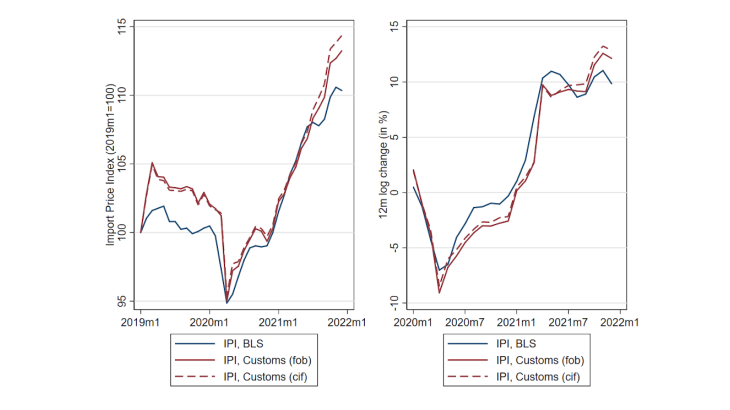
With both CIF and FOB unit values in hand, we compute two aggregate price indices based on a Laspeyres formula. The price index based on FOB Customs unit values naturally differs from the BLS price index, because the former is based on unit values of virtually all import transactions while the second one is based on price changes of items sampled by the BLS. However, the two price indices are highly correlated, both in terms of level and twelve-month changes. (correlation of over 90%, blue and red lines, Chart 2). The CIF Customs price index (red dashed line) has risen faster than the FOB index, which reflects the surge in transport costs. Overall, we find that from January 2019 to December 2021, transport costs have added roughly 1.1 percentage point to the aggregate US import price index. This effect is not negligible, but small relative to the overall increase in FOB import prices of roughly 10 percentage points over the same time period. Moreover, it is likely an upper bound of the effect as foreign exporters may have reduced their prices in response to larger transport costs.


