1. French companies have become more attractive since 2015
Non-residents have invested almost EUR 30 billion per year in equity capital since 2015
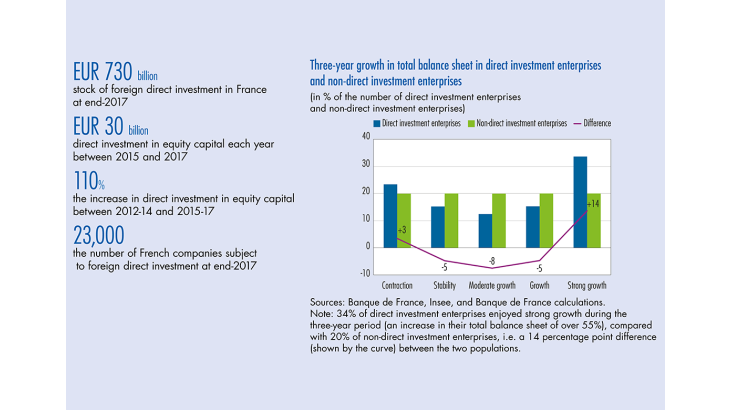
In total, foreign direct investment (FDI) in France amounted to almost EUR 120 billion over the 2015-17 period. This is three times more than during the previous three years and almost as much as total FDI for 2008 to 2014. During the past three years, these investments have on average represented 2% of annual gross domestic product (GDP). In 2017, France was one of only four Organisation for Economic Co-operation and Development (OECD) countries that saw a year‑on‑year increase in their inward foreign investments. In total, the stock of foreign direct investment in France stood at EUR 730 billion at the end of 2017.
The majority of these investments take the form of equity capital transactions, such as purchases of shareholdings or mergers and acquisitions, which reached a record high in 2015-17, with an annual rate of almost EUR 30 billion. Furthermore, every year, part of pre-tax profit attributable to non-resident owners of French companies is not distributed and is instead allocated to reserves as “reinvested earnings”. This represented around EUR 7 billion in new investments per year between 2015 and 2017. Lastly, the flows of intragroup loans and borrowings, which to a large extent reflect the cash flow movements of large multinational groups, generated a net capital inflow in 2017, following a slight outflow in 2016 (see Chart 1).
Industry continues to attract foreign capital
The economic sectors targeted by the direct investments made between 2015 and 2017 partly stand out from those traditionally chosen for investment (identified from stock statistics based on total past investments). For example, the construction sector received almost 20% of foreign direct investment from 2015 to 2017, but only accounted for 3% of stocks. This new orientation is in keeping with a disenchantment with financial and insurance activities. However, industry (see Box 1) and real estate activities continue to predominate, accounting for more than half of stocks and flows between them from 2015 to 2017 (see Chart 2).
[To read more, please download the article]
