Eco Notepad

Financial savings, debt and money holdings during the pandemic

Published on 11 February 2022
Authors : Louis Bê Duc

Post n°256. The increase in the money holdings by the non-financial sector in the euro area and the United States during the pandemic is explained by the strong increase in financial savings linked to public transfers and the sustained growth of loans, and in particular (in the euro area), government-guaranteed loans. Portfolio shifts strengthened the monetary dynamics in the United States, while they dampened them in the euro area.

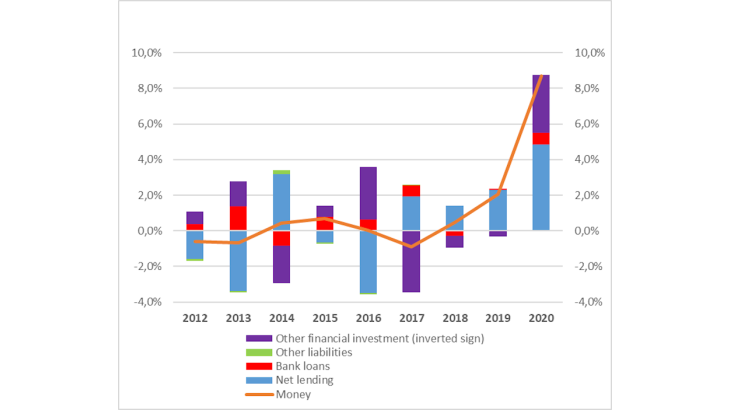
Image Chart 1. Sources of change in money holdings by households in the euro area (Change in annual flows as a % of GDP) Source: Euro area sector accounts, ECB.
Chart 1. Sources of change in money holdings by households in the euro area (Change in annual flows as a % of GDP) Source: Euro area sector accounts, ECB.

Note: The chart shows the change in money holdings (orange line) resulting from the changes in net lending, financial investment and liabilities (bars). Other liabilities includes other accounts payable. Other financial investment includes long-term deposits and debt securities, equities, investment fund shares excluding money-market funds, insurance reserves, other accounts receivable.

The pandemic had a very large impact on the economy, economic agent’s earnings and financial behaviour. Households experienced a very strong increase in their net lending (also referred to in this blog as “financial savings”), together with a surge in money holdings. Money held by households rose by around 9% of GDP in the United States, compared with 3% in the euro area. The articulation between money holdings, net lending, liability issuance and portfolio shifts in the euro area and the United States can be formalized by the following identity:

Money = Net lending + bank loans + other liabilities – other financial investments.

The money stock held by one sector is raised through financial savings (net lending), by incurring loans or by issuing other liabilities (for instance equities and debt securities). It is lowered through financial investments other than money (long-term debt securities, equities, non-money market fund shares and insurance reserves).

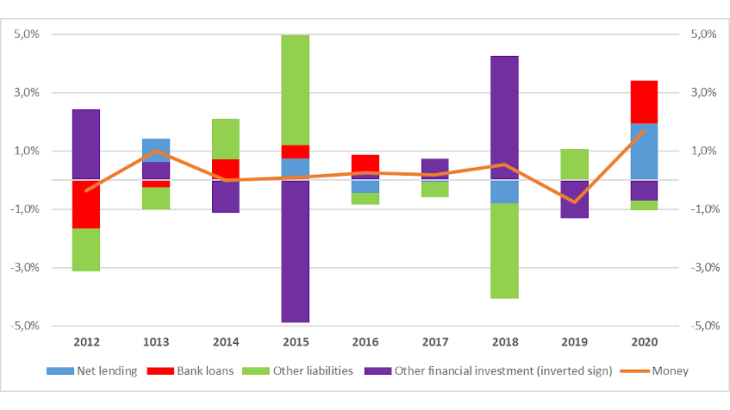
The rise in households’ financial savings was due to the combination of very large public transfers and a fall in consumption as a result of general lockdown. It was the main driver of the growth in money holdings in the euro area and the United States. This surge in money holdings reflects the massive issuance of public debt purchased by monetary financial institutions (MFIs) and channeled into the money holding sectors through public transfers (see Bulletin no 239-2). However, portfolio shifts also played a role, which differed across both regions. In the euro area, the monetary dynamics were attenuated by the increased purchases of higher risk assets: equities, non-money market fund shares and life-insurance reserves. Conversely, in the United States, portfolio shifts into money, i.e. out of debt securities and non-money market fund shares, enhanced the build-up of monetary assets (see purple bar in Chart 2). Bank loans did not play an important role in either area. In the United States, the Fed Survey of Consumer Expectations (March 2021) suggests that one third of households' stimulus checks has been used to pay off their debt.
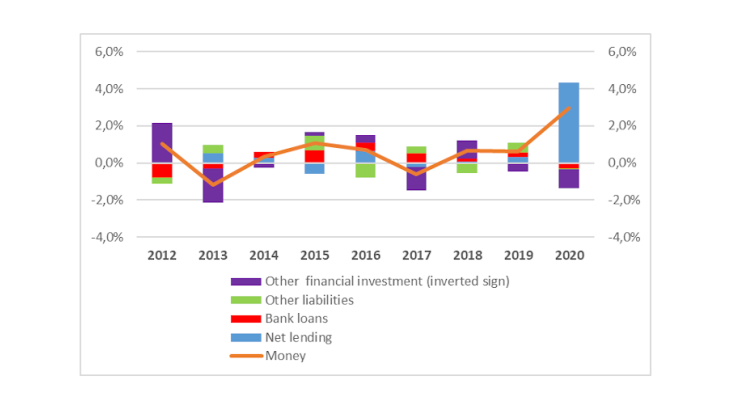
Image Chart 2. Sources of change in money holdings of households in the United States (Change in annual flows as a % of GDP) Source: Financial accounts of the United States, Federal Reserve Board.
Chart 2. Sources of change in money holdings of households in the United States (Change in annual flows as a % of GDP) Source: Financial accounts of the United States, Federal Reserve Board.

Note: The chart shows the change in money holdings (orange line) resulting from the changes in net lending, financial investment and liabilities (bars). Other liabilities mainly includes other accounts payable. Other financial investment includes debt securities, equities, investment fund shares excluding money-market funds, insurance reserves, other accounts receivable.


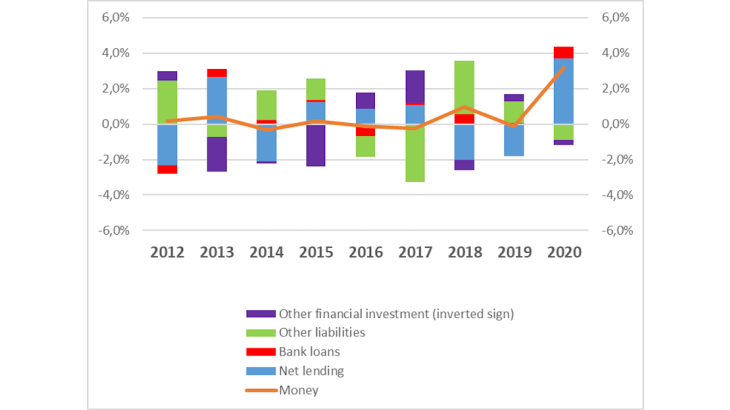
Despite a fall in their primary income, non-financial corporations’ net lending also increased in 2020, both in the euro area and the United States, due to large public transfers and a drastic postponement of investment plans. This rise in net lending (with some exceptions, as in France, which recorded a slight increase in the net borrowing of corporations) largely accounts for the growth in cash hoarding in both regions, since investment in non-monetary financial assets was overall moderate. However, the growth in bank loans, especially in the euro area, also contributed to the strong monetary creation. Indeed, many companies hit by the effects of lockdown were led to have recourse to external funding. On the supply side, the implementation of state-guaranteed loans and, to some extent, the targeted long-term refinancing operations, contributed to easing bank loans to businesses. The growth of loans to US corporations was more moderate: companies more widely relied on corporate bond issuance, which increased, and lending to US non-financial corporations was affected by the loan forgiveness scheme under the Paycheck Protection Program.


Image Chart 3. Sources of change in money holdings of non-financial corporations in the euro area (Change in annual flows as a % of GDP) Source: Euro area sector accounts, ECB.
Chart 3. Sources of change in money holdings of non-financial corporations in the euro area (Change in annual flows as a % of GDP) Source: Euro area sector accounts, ECB.

Note: The chart shows the change in money holdings (orange line) resulting from the changes in net lending, financial investment and liabilities (bars). Other liabilities includes equities, debt securities and other accounts payable. Other financial investment includes long-term deposits and debt securities, investment fund shares excluding money market funds, equities, insurance reserves and other accounts receivable.


Image Chart 4. Sources of change in money holdings of non-financial corporations in the United States (Change in annual flows as a % of GDP) Source: Financial accounts of the United States, Federal Reserve Board.
Chart 4. Sources of change in money holdings of non-financial corporations in the United States (Change in annual flows as a % of GDP) Source: Financial accounts of the United States, Federal Reserve Board.

Note: The chart shows the change in money holdings (orange line) resulting from the changes in net lending, financial investment and liabilities (bars). Other liabilities includes equities, debt securities and other accounts payable. Other financial investment includes debt securities, investment fund shares except money-market funds, equities, insurance reserves, other accounts receivable.


Updated on 25 July 2024