Variety gains in inflation
An important challenge in the measurement of inflation is the presence of “variety gains”. Variety gains refer to the purchasing power gains of consumers that result from a process of creative destruction of products. When new products are in competition with previously sold goods, some of these old goods may have to exit the market. Consumers may gain from this process if the new goods are more competitive than the exiting products (i.e. if their quality-adjusted price is lower).
These variety gains are often unaccounted for in traditional price indices (see Aghion et al. (2019)), but they are explicitly included in our study. More importantly, we can also measure variety gains if products differ in terms of quality. This is particularly relevant in the context of international trade, as the quality of Chinese products may differ from that of US products.
The channels: higher entry/exit of products and pro-competitive effects
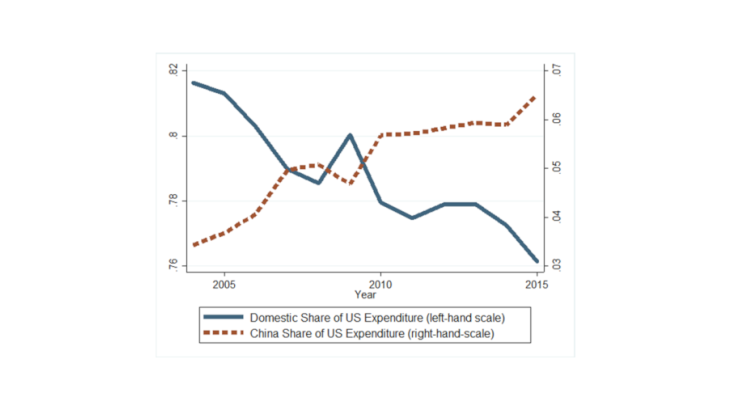
We then compare the price changes in product categories with high Chinese import growth with those in categories with little or no Chinese import growth. We identify three channels through which Chinese imports affect prices in the US product market.
- Chinese imports lead to the entry and exit of goods and the variety gains associated with this process. In product categories with more Chinese import penetration, the entry and exit rates of products are higher. Even though there is no net increase in the number of available products, consumers benefit from variety gains since the new products are more competitive than the exiting ones. Overall, we find that variety gains account for roughly a third of the overall purchasing power gains of consumers.
- The heightened competitive pressure curbs the price increase of previously sold products, and this effect accounts for two thirds of the overall effect. This fall in prices is consistent with pre-existing producers reducing their markups, but it is not conclusive evidence of such pro-competitive effects of trade. It may also reflect a fall in production costs in import-competing industries, for instance through lower wages. For the United States, lower wage growth in import-competing industries has been documented by Autor et al (2014), and for France by Malgouyres (2016).
- The effect on prices of final goods would be even stronger if US companies sourced cheaper intermediate goods from China, and if these cost reductions were then passed on to consumers. We also test for this channel, but the estimates are very imprecise and therefore leave us unable to draw any conclusion about the role of intermediate goods.
A sizable effect on inflation of consumer tradable goods
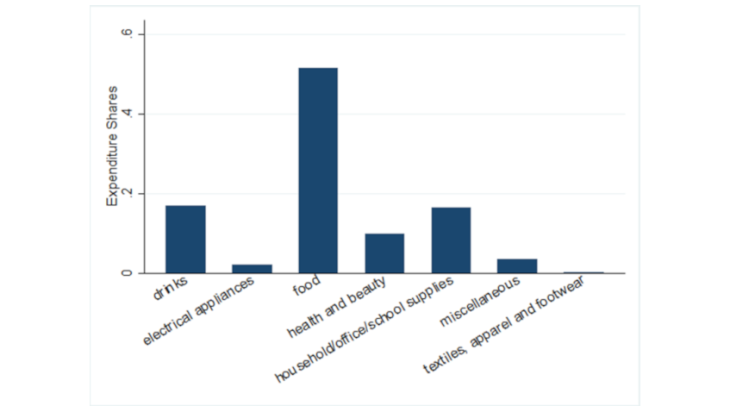
Finally, we do a simple calculation to estimate the aggregate effect of Chinese import penetration on inflation. To do that, we assume that if a product category saw no change in import penetration, then its inflation rate remained unaffected. Based on this assumption, we aggregate the effects on individual product categories, and find that the aggregate inflation of tradable goods was roughly 0.2 pp lower per year. With a share of tradable goods in total expenditure of roughly 0.25, this amounts to a 0.05 pp lower cost of living each year. This effect is slightly lower than the -0.17pp found by Carluccio et al. (2018) for France, possibly because their paper considers the effect of imports from all low-wage countries (not only China), and because imports represent a larger share of total consumer expenditure in France compared to the United States. With average household expenditure on tradable goods of roughly USD 10,000, our estimates imply that the cost of living per household was roughly USD 210 lower in 2015, due to Chinese import penetration in the period 2004-15.
Do some households benefit more than others?
To estimate potentially heterogeneous effects across the population, we divide households into different groups by income and by region of residence within the United States. For each of these groups, we reconstruct inflation rates for every product category. However, we fail to find any evidence of substantially different effects across households. Inflation for consumer tradable goods fell by similar amounts for all groups. However, effects on overall inflation (across all consumed goods and services) are likely to differ across households, since low-income households typically record a higher share of expenditure on tradable goods (see Fajgelbaum and Khandelwal (2016)).
Finally, it is also important to note that our results do not summarise the total welfare effect of Chinese import penetration for the United States, as we do not analyse any potential negative effects on employment and wages, as documented, for instance, by Autor et al. (2013). Overall, however, our results highlight the benefits to US consumers from Chinese imports, and also imply substantial losses to US consumers from the ongoing US-China trade war (see Faigelbaum et al. 2019 for an assessment of the US welfare change due to the current trade war).

