Eco Notepad

Covid-19 and divergence in GDP declines between Europe and the United States

Published on 27 September 2021
Authors : Nicolas Châtelais

Post n°229. In 2020, the fall in GDP was less pronounced in the United States than in Europe. The restrictions on activity and travel – both imposed and voluntary - linked to the fight against the pandemic, which were greater in France/Italy/Spain, account for more than 40% of the gap with the United States. This factor was amplified by the difference in sectoral specialization (US digital advantage, weight of tourism in Europe). The difference in the level of fiscal support explains less than 20% of the gap.

Image Factors explaining the gap in GDP variation between the United States and Europe in 2020
Chart 1: Factors explaining the gap in GDP variation between the United States and Europe in 2020
Sources: IMF, national, author’s calculations

Key: the difference in constraints on activity explains 40% of the growth gap between the United States and the FR+IT+ES group. The greater dependence on tourism in these three countries explains just over 20% of the gap with the United States

80% of the gap is due to differences in the reaction of economic agents and sectoral specialisation

We used our results (see Banque de France Bulletin No. 237 for more details) to understand why the United States, despite being heavily affected by the epidemic, suffered a smaller negative shock to GDP (5.6%) than certain European countries, in particular France (9.5%), Italy (9.5%), Spain (12.7%) and the United Kingdom (11.4%). Many factors can explain the differences. Beyond the United States and the euro area, we tested for a panel of 52 countries, the relationship between, on the one hand, a measure of the shock to GDP in 2020 (the difference between actual GDP growth in 2020 and its forecast published by the IMF in October 2019) and, on the other, 85 candidate variables that we grouped into seven categories:

  1. structural macroeconomic characteristics (e.g. share of tourism and consumption in GDP, etc.);
  2. level of development, demographics and health (e.g. fragility of the population, hospital capacity, etc.);
  3. fiscal responses to cushion the economic shock (e.g. financial support for households, cash-flow measures for companies, company recapitalisations, etc.);
  4. reactions of governments and economic agents, measured by an Effective Activity Constraint Indicator (EACI) which takes into account de jure restrictions (measures taken by governments to fight the pandemic summarised by data from Oxford University) and de facto restrictions (reduced mobility of economic agents summarised by data from Google Mobility);
  5. degree of intensity of the pandemic (e.g. number of cases, number of deaths, etc.);
  6. technological development (e.g. development of teleworking, internet coverage, etc.);
  7. state of the economy before the crisis (e.g. level of government debt, level of savings, etc.).

The first explanatory factor is that US government (federal and state) constrained activity less and economic agents restricted their movements less. This explains 42% of the gap with the France/Italy/Spain group, i.e. just over 2pp of difference in the variation of GDP (Chart 1 and Table 1).

Image Contributions to the difference in the variation of GDP with the United States in 2020
Table 1: Contributions to the difference in the variation of GDP with the United States in 2020

Key: for the three countries France + Italy + Spain, the technological lag explains 0.8 point of the 5% additional drop in GDP compared to the United States.

This factor was amplified by the US economy's lesser dependence on tourism compared to the France/Italy/Spain group (for 20% of the difference, i.e. 1.2pp. in the variation of GDP).

In addition, the United States’ technological lead (share of service sectors where work can be done from home, use of new technologies to rapidly implement teleworking and business-to-business activity via the internet) accounts for about 16% of the divergence with the France/Italy/Spain group. Teleworking is particularly widespread in California (new technologies), New York (finance), Florida (health) and Illinois (insurance).

Lastly, the fiscal stimulus differential in 2020 in favour of the United States explains only 20% of the gap with the FR/IT/ES group, i.e. 1.1 pp. This result is an upper bound, since alternative econometric specifications conclude that it accounts for around 10%. It should be noted that, according to our calculations, the faster reaction of the euro area countries may have reduced the difference in GDP losses but does not cancel out the difference in impact of the lockdown measures.

Two thirds of the additional loss of GDP in the United Kingdom in 2020 can be explained by greater constraints on activity (3.8 pp). Sectoral specialisation (tourism and technological development) accounts for the rest of the gap with the United States; the fiscal stimulus being of relatively similar size.

Differences in GDP losses between the United States and the EU but also within these two groups

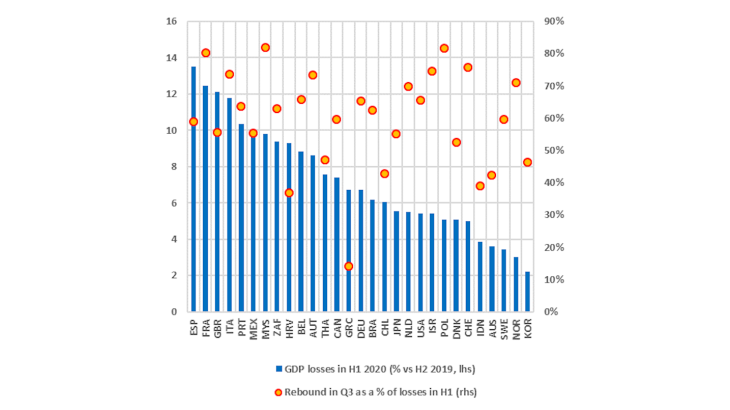
First, it should be noted that the difference in the shock to GDP in 2020 between the United States (-5.6%) and the United Kingdom (-11.4%) or the euro area countries (-8.1%) is essentially due to the loss recorded in the first half of the year, with all the countries experiencing a percentage rebound at least as large as that in the United States in the third quarter. Indeed, the US GDP recovered 70% of the losses, from the first half of the year to the third quarter, which is the average of our panel where most countries recovered between 55% and 80% of the losses (Chart 2).
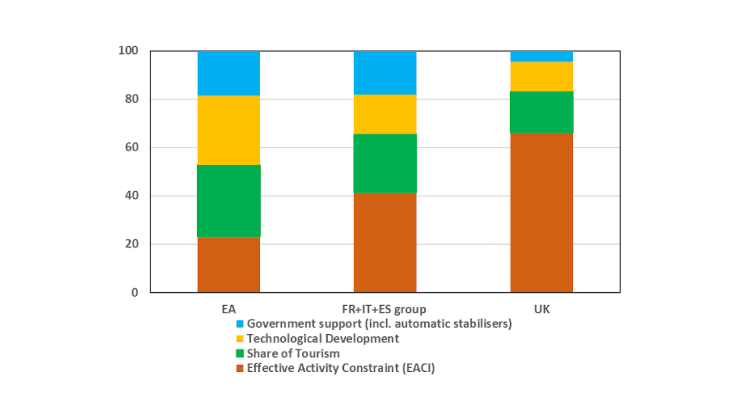
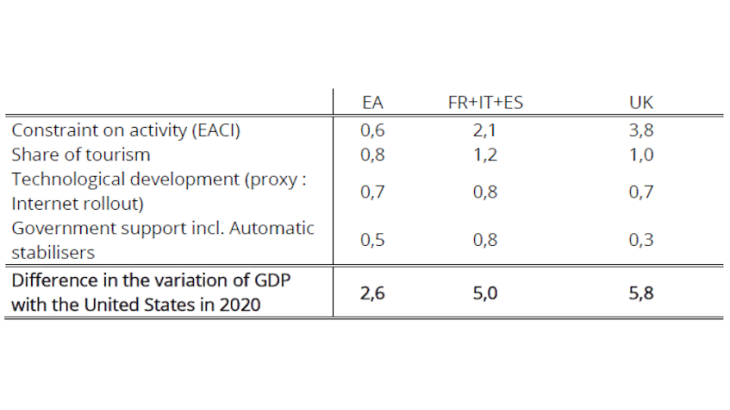
Image GDP losses in H1 and rebound in Q3
Chart 2: GDP losses in H1 and rebound in Q3
Sources: IMF, national, author's calculations

Key: European countries (left-hand scale) experienced a greater loss of GDP in the first half of the year (blue bars) but recovered a proportion equivalent to that of other countries, which suggests a stronger recovery.

Second, the impact of the pandemic was highly heterogeneous across Europe but also across the United States.

In Europe, the northern countries suffered a limited shock of 4.5% on average, compared with 10.6% for the France/Italy/Spain group, 11.4% for the United Kingdom and 6.5% for Germany. In the United States, the decline in 2020 ranged from -0.1% in Utah to -8.0% in Hawaii.

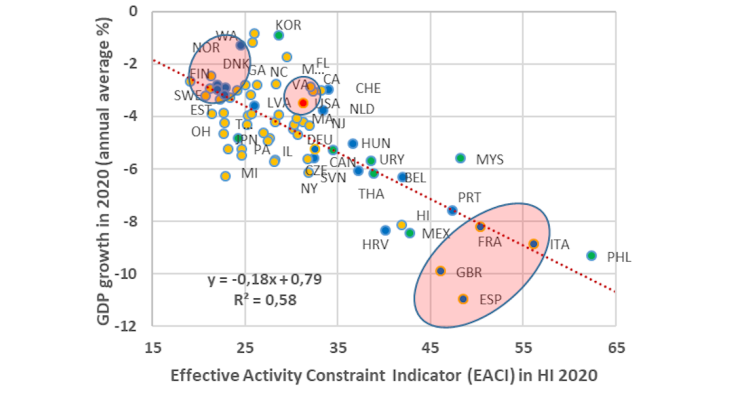
The declines in GDP are consistent with the constraints (EACI) that have been put in place, for advanced or large emerging countries, but also for the US states (Chart 3). However, a few states are an exception, in particular two of the four largest which account for more than 20% of US GDP, namely California (14.7%) and Florida (5.3%). Admittedly, these were severely hit by the crisis but less than expected in view of the constraints.

This can be due to their productive specialisation (respectively information technology and health). The State of New York (8.1% of US GDP) and Hawaii suffered greater losses than the US average according to the EACI because both states depend greatly on tourism: in Hawaii, the contribution of the accommodation and food services sector (8.5% of the state's GDP) to growth was 61% lower in the second quarter of 2020 than it was in the second quarter of 2019. Similarly, in the State of New York the accommodation and food services sector recorded a loss of nearly 70% in the second quarter of 2020 compared to the same quarter a year earlier. As a result, the total GDP of the State of New York was down nearly 12% in the second quarter of 2020.

Image Declines in GDP and activity-constraining measures in US states and Europe
Chart 3: Declines in GDP and activity-constraining measures in US states and Europe
Sources: IMF, author’s calculations

Key: on average, the US states (in yellow) constrained their activity less than the large European states (in blue, bottom red area), but more than the northern European countries. The other countries (in green) are highly dispersed.

Updated on 29 March 2024