- Home
- Publications et statistiques
- Publications
- The climate is changing, and European of...
The climate is changing, and European official statistics are adapting
Post n°317. The European Central Bank has published indicators aimed at analysing the impact of climate-related risks on the financial sector, using a harmonised and transparent methodology. While these indicators rank France favourably in comparison with its European neighbours, they still have their limitations and should be viewed with caution; further studies will seek to enhance their robustness.

Climate data faces three challenges: availability, reliability and comparability (Grisey, 2022). In order to develop new climate-related risk indicators in the short term, one therefore needs to draw on existing resources, while awaiting changes in climate disclosure regulations.
Against this backdrop, the European Central Bank's (ECB) climate action plan, adopted in 2021 following its strategic review, contributes its fair share to producing statistics. This led to the development of climate-related statistical indicators by a group of Eurosystem experts, which are being published for the first time in 2023.
These indicators cover the two main channels through which climate change can affect financial stability (Carney, 2015 ; NGFS, 2019):
- The transition risks associated with the transition to a low-carbon economy (regulatory reforms, technological developments, etc.), measured by four carbon footprint indicators for the portfolios of financial corporations (FCs).
- Physical risks, which cover the financial impact of extreme weather events (e.g. floods) or gradual changes (e.g. increase in average temperature), measured by three indicators that take into account 7 climate hazards.
These indicators provide a better measure of climate-related risks for the financial sector
For euro area countries, these indicators are based on granular data on the non-financial corporations (NFCs) to which FCs are exposed, via the loans they have granted or the securities they hold. By estimating the carbon footprint or exposure to climate-related risks of each NFC included in the portfolios of financial institutions, this approach makes it possible to aggregate these data to obtain indicators broken down by different categories (e.g. country, type of FC, etc.).
The four carbon footprint indicators seek to:
- Measure the role of FCs in financing CO2e emissions. This is the case for the financed emissions and carbon intensity indicators, which measure the contribution of investors to financing the emissions of companies, based on the assumption that an issuer's emissions or carbon intensity would only have been possible if it had received financing from a financial institution.
- Assess the exposure of an FC to transition risk. This is the role of the weighted average carbon intensity (WACI) & carbon footprint indicators, which focus on the FC's portfolio by assessing the proportion of financing of issuers’ emissions in the overall portfolio, thus taking the opposite perspective.
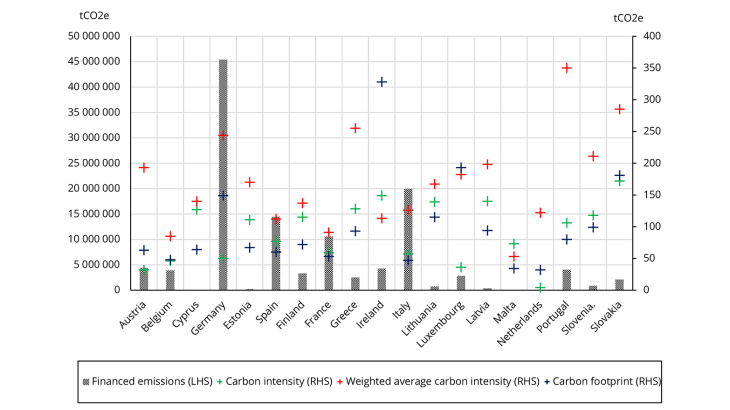
In 2020, French banks financed 10.59 million tonnes of CO2e through the credit channel. They are the fourth largest contributors in the euro area, behind Germany, Italy and Spain. If we take into account the carbon efficiency of the counterparties (carbon intensity), French banks rank seventh. Lastly, if we eliminate the effect of balance sheet size (WACI, carbon footprint), French banks are the fourth lowest contributors (Chart 1).

Three indicators aim to measure physical risk:
- The normalised exposure at risk indicator gives an estimate of exposure to physical risk, taking into account the amount of exposure of the financial sector to NFCs, as well as the frequency/intensity of the hazard to which they are exposed and their associated physical and financial vulnerability. It covers only river flooding, coastal flooding and windstorms.
- The potential exposure at risk indicator provides the maximum share of the portfolio exposed to the above hazards, as well as to subsidence, landslides, water stress and wildfires. It does not take into account their frequency or intensity. Here, the total value of a security is considered to be at risk if at least one of the issuing group's subsidiaries is exposed to one of the hazards.
- The risk scores indicator refines the previous indicator by dividing exposure into several risk classes according to the frequency of the associated hazards (intensity is still not taken into account).
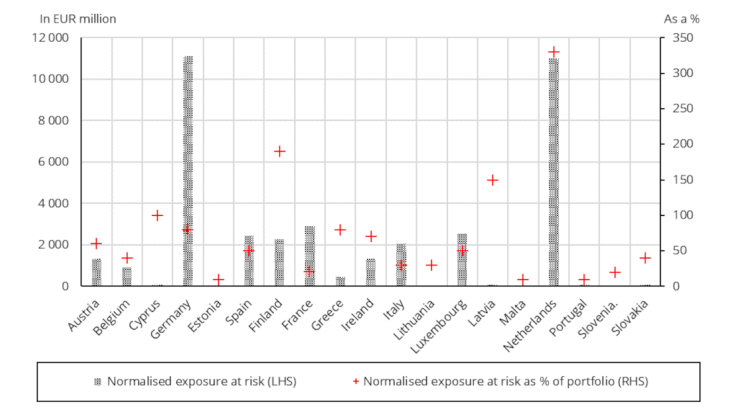
In 2020, 0.2% of the portfolio of French FCs, i.e. EUR 2,912 million, appears to be exposed to physical risks via loans or securities issued by NFCs. French FCs are the third most exposed in the euro area (by volume), but the fourth least exposed as a percentage of their portfolio (Chart 2).

However, these indicators should be used with a degree of caution
The main purpose of these indicators is to use official statistics to analyse climate-related financial risks. Indeed, their publication was accompanied by a detailed report explaining the different methodologies used and their limitations.
One of the limitations common to all the indicators is the fact that financial data (e.g. turnover) are incomplete. As a result, some of these indicators are calculated using imputed data, which can affect their accuracy.
To assess their robustness, we test the sensitivity of the carbon footprint indicators using INSEE data on French companies instead of the database used by the ECB to compile the indicators, which is less complete but covers all euro area member countries. Naturally, the results obtained suggest that a better coverage of the population of companies has a non-negligible effect for the absolute indicator (financed emissions), but a lesser effect for the other three indicators, which represent averages.
Furthermore, the carbon footprint indicators only cover part of the scope of emissions: those associated with the production process (Scope 1) and energy consumption (Scope 2), but not indirect emissions, such as the extraction of materials purchased by an NFC (Scope 3).
The accuracy of physical risk indicators suffers from uncertainties over the location of assets and the failure to take account of insurance cover, which affects the distribution of risk between financial sectors and between jurisdictions.
Up to 2024, work will continue on improving the robustness of the indicators
The financial data coverage rate and the accuracy of the location of physical assets should gradually be refined. Data available at national level (e.g. in France, the geolocalised SIRENE database) can contribute to the harmonised approach, or propose alternatives. Changes in the European regulatory framework (in particular the Corporate Sustainability Reporting Directive (CSRD)) and the accounting normalisation processes will improve the availability of granular information, particularly on emissions.
Additionally, the methods for estimating NFC emissions, calculating indicators (a greater range of hazards considered for physical risk, integration of Scope 3 for the carbon footprint), and their forward-looking nature (NFC emissions trajectories, extreme hazard projections) will also be studied.
Download the PDF version of the document
Updated on the 25th of July 2024