- Home
- Publications et statistiques
- Publications
- Are financial variables a useful complem...
Post n°136. Severe financial market stress can result in significant errors in the forecasting of quarterly GDP growth. This post focuses on the impact of financial variables on the short-term forecasting of GDP in France. A financial conditions indicator can provide useful qualitative information to the forecaster on the risks associated with the baseline projection.

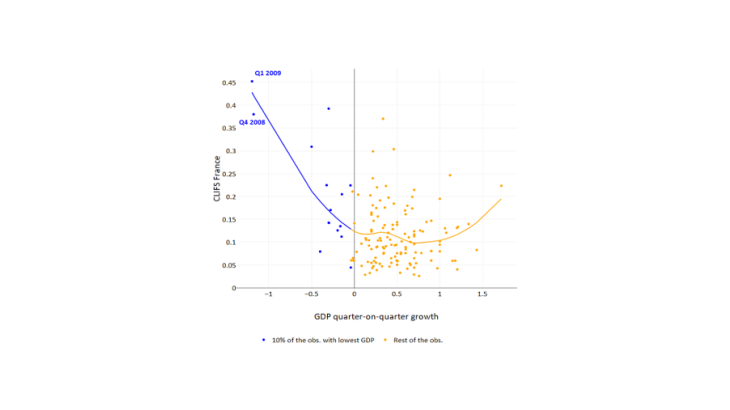
Note: The dots in the chart represent combinations between the Country-Level Index of Financial Stress (CLIFS, y-axis) and GDP growth (x-axis) for a given quarter. A high CLIFS value corresponds to a period of significant financial stress. The blue dots on the left hand side of the chart show the 10% of quarters with the lowest GDP growth. The line represents a polynomial curve for the relationship between the two variables.
The Monthly Index of Business Activity (MIBA) is an effective model for detecting economic downturns
The MIBA (Mogliani et al., 2014) is the model used by the Banque de France for forecasting GDP growth for the coincident quarter (nowcasting). It uses the lagged value of GDP and the balances of the Banque de France's monthly business surveys to forecast, each month, the quarter-on-quarter growth in GDP before its first publication in INSEE’s quarterly accounts. The MIBA is estimated by ordinary least squares and the average forecast is assumed to follow a normal distribution law. Symmetry in the distribution does not allow us to highlight certain risks associated with this point forecast. The MIBA model nevertheless allows for a robust and reliable forecast early in the quarter thanks to the quality of the Banque de France business surveys.
Why take account of financial variables for short-term forecasting?
Despite its good performance, the MIBA model did not capture the full magnitude of the crisis in Q1 2009, the second consecutive quarter of negative growth in France during the 2008 crisis. This highlights the importance of taking into account additional specifications to better predict recession periods over the short run. Financial variables are an alternative for enriching forecasts of business conditions because they should capture the shocks that may be underestimated by other variables during a downturn.
Tighter financial conditions can be associated with a decline in real activity (particularly the case in 2008-2009). We will use here an indicator specific to France calculated monthly by the European Central Bank (ECB): the Country-Level Index of Financial Stress (CLIFS) for France, which measures financial stress on bond, equity and foreign exchange markets.
The CLIFS for France and GDP appear to be mainly negatively correlated in crisis periods. This observation suggests a non-linear relationship between economic activity and financial conditions. Chart 1 confirms this intuition: dots with strongly negative GDP changes (blue dots, top left of the chart) are characterised by high CLIFS levels (especially in Q4 2008 and Q1 2009).
How to take into account financial variables to supplement the short-term forecast for France?
One solution to account for this non-linear relationship is to use quantile regressions to construct a conditional distribution of the GDP forecast. This is known as the growth-at-risk approach, developed by Adrian et al. (2017) and applied to the euro area. Using the forecasts from quantile regressions, a GDP density is constructed to assign a probability to the different possible values of expected growth.
However, these techniques are not forecasting tools but models that focus on the risks that exist in the economy at a given time. This post proposes to combine the MIBA forecast with these "growth-at-risk" techniques to better identify downside risks. To this end, we adapt the methodology developed by Adrian et al. (2017) and apply it to French data for the 1983-2018 period.
- For financial conditions, we use the CLIFS France index as at the time of the forecast. In the original paper by Adrian et al (2017), the authors use an index of financial conditions in the United States, incorporated into the regression with a lag.
- Above all, to measure economic conditions, we use all the information available at the time of the forecast. We use a two-step approach: (i) we calculate the standard MIBA forecast for the coincident quarter from the lagged value of GDP and the Banque de France survey balances available in the 2nd month of the quarter; (ii) we then include this forecast as an explanatory variable in the quantile regression.
The quantile regression is therefore based on an economic variable summarising the information available in the Banque de France's business surveys (standard MIBA forecast) and a financial variable (CLIFS France). We use the "growth-at-risk France" model to designate this specification. Intuitively, this method is equivalent to capturing the non-linearities that the MIBA model does not take into account.
GDP growth density forecasts are a useful supplement for the baseline MIBA forecast
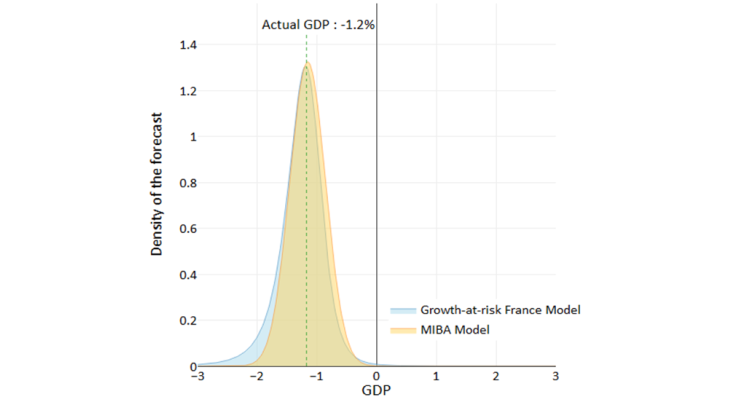
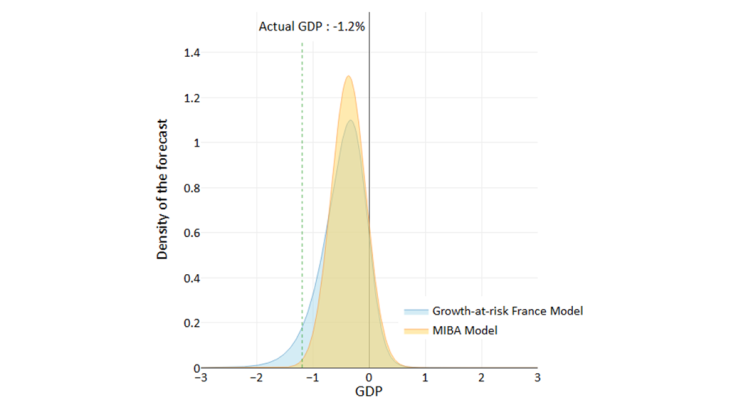
To illustrate our methodology, we take the example of two consecutive quarters of negative quarter-on-quarter growth in Q4 2008 and Q1 2009. In Charts 2 and 3, we compare the symmetric forecast provided by the MIBA model and the forecast of the “growth-at-risk France” model.


In Q4 2008, the probability distribution lies within the negative value range, with a median equal to the realised GDP for both models (-1.2% in the preliminary estimate). In Q1 2009, the distribution also remained in negative territory, with a median of -0.4 (compared to -1.2% for realised GDP). The "growth-at-risk France" model can supplement the forecaster's assessment in two ways:
1) A slight shift in the distribution median in Q4 2008, which can be interpreted as a one-off forecast for the quarter under review. The MIBA model forecast (-1.1% and -0.4% in Q4 2008 and Q1 2009, respectively) is relatively close to that of the "growth-at-risk France" model median. However, this shift remains relatively small: this could be explained by the fact that the sentiment of business leaders in the Banque de France's business survey already factors in useful information on financial market stress.
2) A fatter lower tail of the distribution, indicating the high downside risk associated with the growth forecast of the MIBA model. We observe a significant area difference between the two forecast densities: the distribution tail to the left of the forecast density of the "growth-at-risk France" model is above the MIBA density in yellow. This area difference indicates an increased probability of growth of less than -1%.
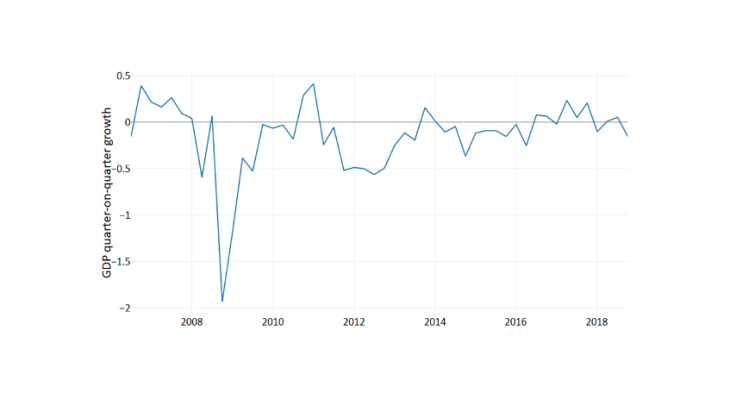
All in all, the forecasts of the "growth-at-risk France" model, compared to the MIBA forecast, show a slight reduction in the out-of-sample forecast error during the crisis period. Indeed, this specification reduces the error by about 0.1 percentage point in Q4 2008 and Q1 2009 compared to the MIBA forecast if we consider that the forecast corresponds to the median of the distribution. If we take the 5% quantile of the forecast density like the one presented in Chart 2, it is possible to measure the downside risk associated with the forecasts (Chart 4). These periods of downward risk correspond closely to crisis periods (such as the Great Recession and the euro area crisis in 2012).

In conclusion, including a financial conditions indicator makes it possible to refine the forecaster's assessment of the economic situation by monitoring changes in the density of the GDP forecast. In particular, this approach allows us to better anticipate downturns, by identifying downside risks that are difficult to measure using conventional average-based methods and symmetric distributions.
Updated on the 25th of July 2024