- Home
- Deputy governors' speeches
- Galloping profits?
Galloping profits?

Agnès Bénassy-Quéré, Second Deputy Governor of the Banque de France
Published on the 23rd of June 2023

The European Central Bank (ECB), through its President, Chief Economist, and Director General Economics (and colleagues), issued a warning about rising profits in the euro area, which could have helped to fuel inflation in 2022. With wages having, on average, risen less quickly than prices over the past year, it is only reasonable to wonder to what extent wages and profits, respectively, have contributed to inflation.

At the beginning of the energy crisis, governments shouldered the bulk of the loss in household income caused by higher import prices (see Clavères, 2022; Villeroy de Galhau, 2022). However, firms have gradually been able to pass on cost increases, and households and firms have begun the tit-for-tat process that Guillaume Clavères and I described in February on Telos, and more recently modelled in an elegant paper written by Guido Lorenzoni and Iván Werning: workers demand wage increases to preserve their purchasing power. But firms then pass on these wage increases in their prices, meaning that workers have to request a further wage increase, etc.
Inflation therefore ultimately depends on the relative expectations of workers (in terms of the purchasing power of wages) and firms (in terms of their margins). Conflicting expectations can lead to self-sustaining inflation and this is why central banks are concerned.
The labour share
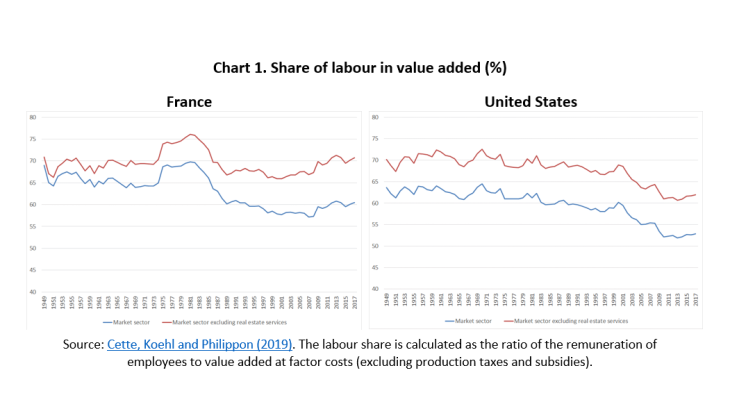
Let's go back to basics: the value-added created by the productive sector over a quarter or a full year is distributed to the two factors of production, labour and capital, as well as to the government via taxes on production and on goods. Since the mid-1980s, the labour share has remained relatively stable in France - a trend that contrasts with the decline observed in the United States (Chart 1). The labour share has even remained stable in France over the very long run if we exclude real estate services, which by definition essentially remunerate capital via real or imputed rents.
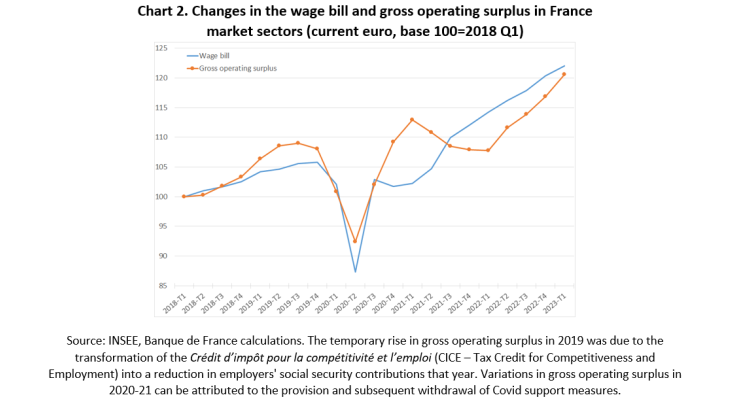
During the most recent period, with the exception of the minimum wage (SMIC), wages have risen more slowly than consumer prices, resulting in a decline in the purchasing power of wages in France. However, employment has risen sharply, meaning that the wage bill has grown at more or less the same rate as value added. Gross operating surplus, which in national accounts represents remuneration of capital, has also risen in line with value added. Between early 2018 and the beginning of 2023, the wage bill, gross operating surplus and value added have all increased by around 20% across all market sectors (Chart 2). We indeed witnessed an acceleration in gross operating surplus in 2022, however this offset a decline recorded in the second half of 2021. In other words, the ratio of gross operating surplus to nominal value added has returned to its 2018 level (see Insee Economic Outlook - March 2023).
There appears to be a significant gap between this clinical statistical observation and the 'perception' of a marked increase in firms’ profits, to the detriment of workers. There are many possible explanations for this difference:
- We tend to extrapolate changes in the purchasing power of wages to changes in purchasing power in general. As mentioned above, employment growth has contributed significantly to purchasing power since 2018.
- We have read in the press how certain firms have generated exceptional profits and we extrapolate this to all businesses. However, these big profits have generally been made in certain specific sectors such as freight transport, while other firms have seen a decline in their profits that may not necessarily have been reported in the press, for example in construction or market services (especially in the accommodation and food services sector). Moreover, the profits of large, highly internationalised French firms, such as those of the CAC40, particularly in the energy sector, are largely generated outside France and are therefore not factored into the calculation of their share in value added (consistent with the definition of gross domestic product).
- We are particularly sensitive to the agri-food sector, where, according to INSEE, the share of gross operating surplus in value added at the end of 2022 was more than five percentage points above the level recorded in early 2018.
- Following on from the previous point, the price index used to calculate the profit share in value added is, logically, the price of value added, which has risen more slowly over the period than the consumer price index due to the sharp increase in prices of imported goods (particularly energy).
- Lastly, it is normal for corporate profits to rise in line with inflation. The real question is whether they are rising faster than wages and in a sustainable manner.
Contribution of profits to inflation
To what extent has the recent rise in unit profits (gross operating surplus in current euro per unit of value added in volume) contributed to inflation? We will focus here on the price of value added, i.e. the price billed by firms, adjusted for the price of their inputs. This price gives the value of one unit of value added (VA), i.e. the sum of the labour cost of one unit of value added (the unit labour cost) plus the capital cost of the same unit of VA (the unit profit).
During a period of inflation, all costs per unit produced increase. Assuming that the share of labour and capital in value added is two-thirds and one-third, respectively, if all unit values increase at the same rate, say by 4%, the contribution of the unit labour cost would be 4% x 2/3 = 2.6%, while that of the unit profits would be 4% x 1/3 = 1.3%.
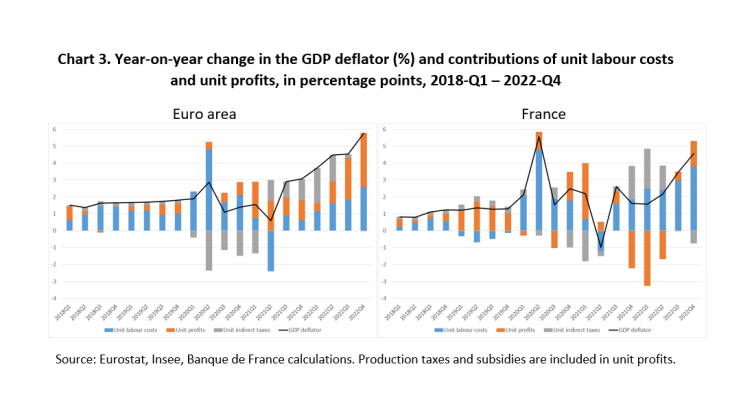
Have unit profits contributed more than their share over the recent period? Chart 3 answers this question for the euro area and for France. To facilitate comparison, the chart represents the economy as a whole and not just the market sector. It therefore shows the GDP price or “deflator” and not the price of market sector value added. In the second half of 2022, the contribution of unit profits to inflation was greater than the contribution of unit labour costs in the euro area. However, in France, the contribution of unit profits was less than that of unit labour costs, after having been negative in the first half of 2022. The chart also shows the contribution of net indirect taxes that, in accounting terms, makes it possible to move from a notion of value added to one of gross domestic product (GDP).
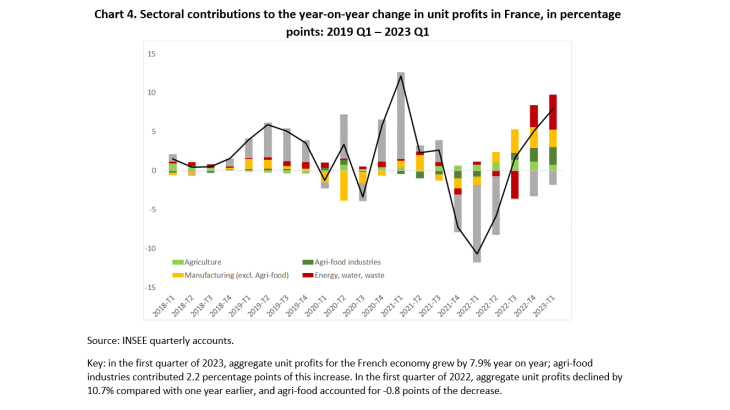
This overall analysis masks significant disparities across sectors. In France, for example, agri-food and other manufacturing industries appear to have driven up unit profits over the past few quarters, whereas these sectors had very limited impact on the decline in aggregate margins in early 2022 (Chart 4). Other sectors, such as hospitality and catering, or other market services, have seen their profits drop over the period. Despite its limited weight in GDP, the agricultural sector contributed positively to aggregate unit profits in 2021-22. However, the sharp increase in input prices for this sector makes it difficult to interpret this contribution (see Colonna, Torrini and Viviano, 2023).
Alternatively, one can calculate the profit margin (i.e. the ratio of price to unit labour cost) instead of the unit profit (profit per unit of value added). If the price of value added increases at the same rate as unit labour costs, then profit margins will remain constant and their contribution to inflation will be zero (the price of value added increases in line with the unit labour cost). Chart 5 shows that in the euro area, profit margins increased in 2021 and 2022, partly reflecting a catch-up effect following the decline recorded in 2020, and this has contributed to inflation. In the case of France, the change in aggregate profit margins was more uneven due to the massive support received by firms in the second half of 2020 and first half of 2021, followed by a subsequent downward spike, before returning to early 2018 levels by the end of 2022.
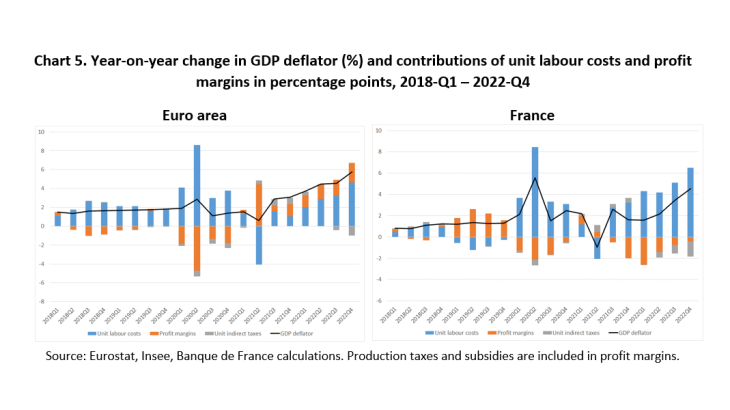
In the first quarter of 2023, based on INSEE’s first estimates, the profit margins of non-financial corporations rose by 0.4 percentage point compared with the previous quarter in France, mainly due to the reduction in the cotisation sur la valeur ajoutée des entreprises (CVAE – corporate value added contribution) and support with paying energy bills. The profit margin however remains at around 32%, its medium-term value.
Micro versus macro
A microeconomist would probably challenge the previous profit calculations. Indeed, a firm sets its price not in relation to its average cost (the unit labour cost), but in relation to its marginal cost (i.e. the cost of the last unit produced): if the firm in still in business, this is because it generates a sufficient trading margin on its variable costs to cover its fixed costs. The actual price is determined not by fixed costs, but by the marginal cost and by market structure.
Based on this principle, De Loecker and Warzynski (2012) have proposed a simple formula for calculating each firm’s trading margin or markup, which Bauer and Boussard (2020) applied to French firms between 1984 and 2016. Consistent with the national accounting approach, they found the aggregate markup to be stable over this period. However, this stability stems from a combination of a decline in the individual markup of each firm and a reallocation of production to firms with a higher markup (composition effect). Unfortunately, the individual data needed to update this research are only available with a two-year time-lag.
Given all of these methodological difficulties, it is advisable to compare different ways of measuring profits and to observe them over sufficiently long periods. The problem is compounded by difficulties of interpretation when the price of imported inputs rises sharply.
Updated on the 21st of November 2023