Global imbalances: what’s new?

Agnès Bénassy-Quéré, Second Deputy Governor of the Banque de France
Published on 8th of December 2023

CEPR Paris Symposium
Welcome to the Banque de France. We are extremely happy with our partnership with the CEPR. The symposium is its most visible part, and having it in Paris means a lot to us - we really appreciate this collaboration.
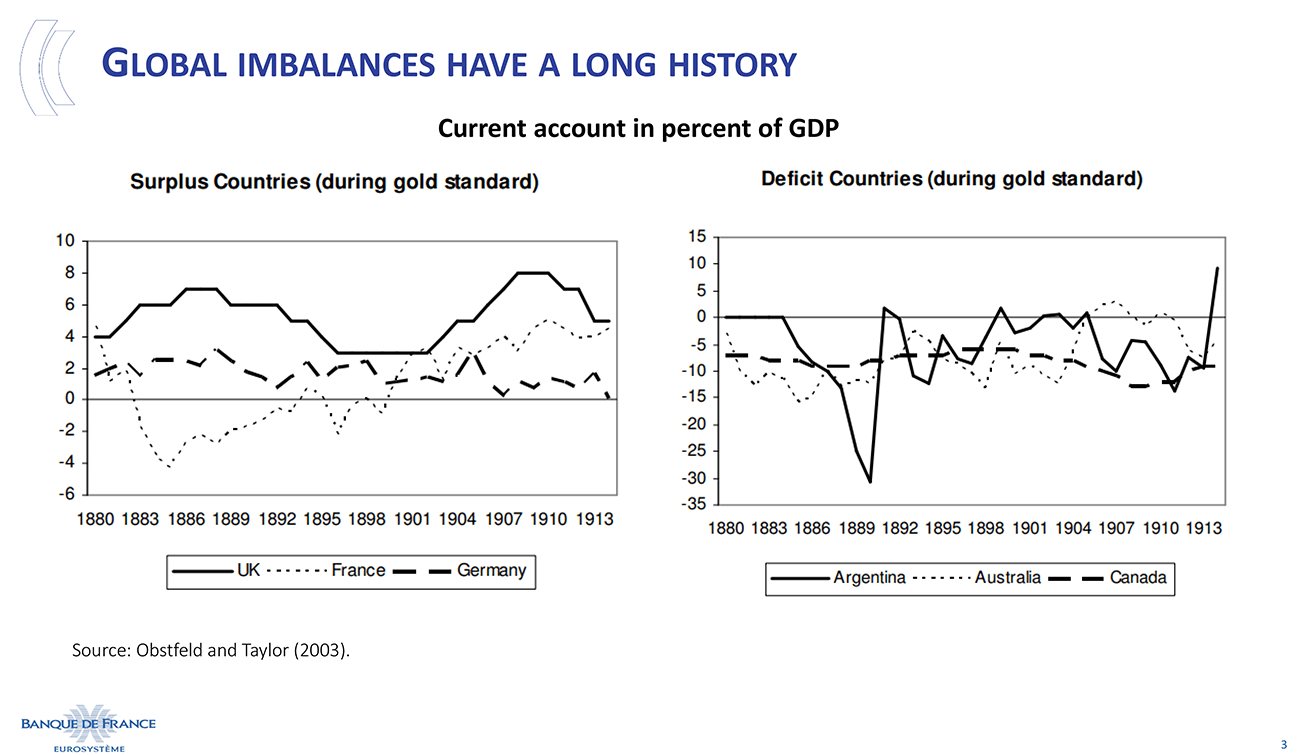
My topic today is global imbalances. I will start with a few stylized facts, first coming back to the old period of the gold standard.
The long history of global imbalances: decline and re-emergence of global imbalances in the XXIst century
Global imbalances are not new: they were already very large during the gold standard period. On my slide [slide 3], the left-hand graph shows countries with current account surpluses up to around 6% of GDP. The right-hand graph shows countries with around 10% of GDP deficits. The price–specie flow mechanism, which should have corrected imbalances under the Gold Standard, was not working properly. Starting in years 1970’s, with the introduction of flexible exchange rate regimes, external adjustment would hopefully be facilitated.
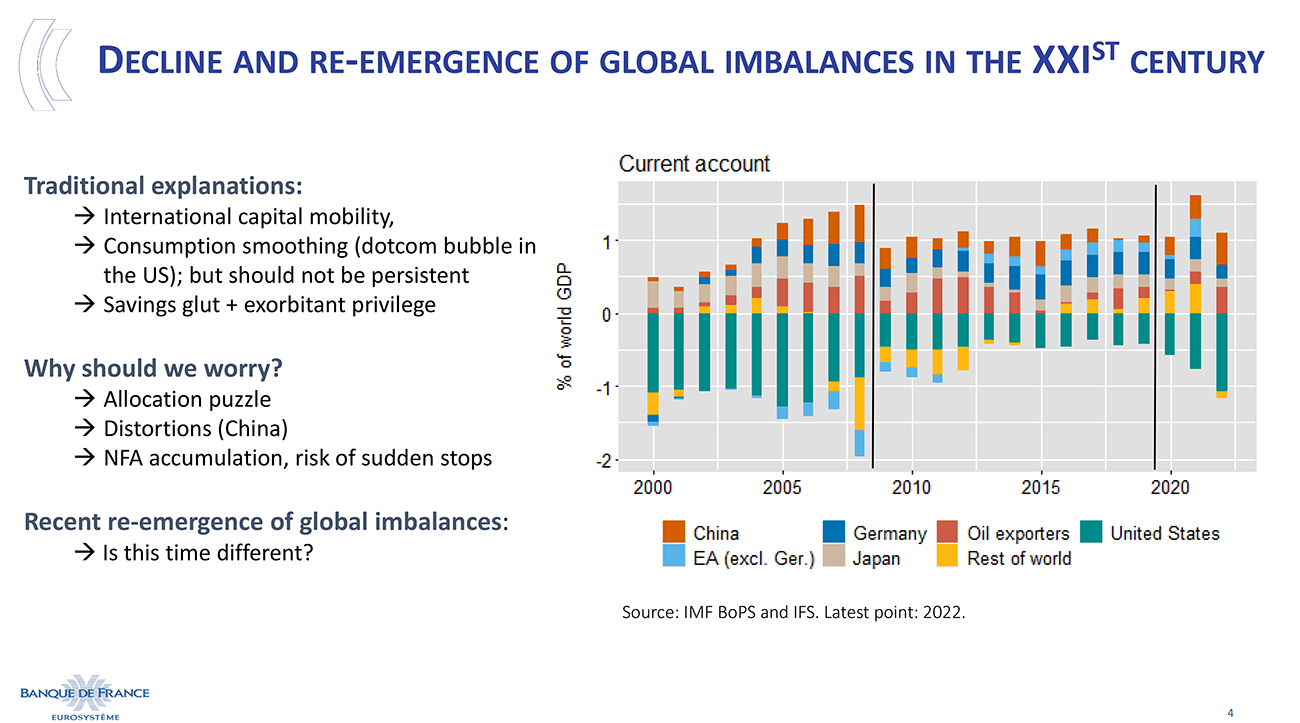
The 21st century started off with growing current account imbalances, followed by a contraction of these imbalances after the Global Financial Crisis [slide 4]. Then, after the COVID crisis, global imbalances started to grow again. Several explanations were given for the re-emergence of global imbalances in the 21st century: consumption smoothing, international capital mobility, more efficient allocation of capital, but also the savings glut as well as the exorbitant privilege.
We should not worry, however, about the imbalances themselves, but about their persistence and their accumulation. An abundant literature about allocation puzzles analyses the distortions that hinder the efficient allocation of capital, cause an accumulation of net foreign asset positions, and induce a need for constant refinancing for some countries.
Our question today is the re-emergence of imbalances after 2020, and whether this mechanism differs from previous events.
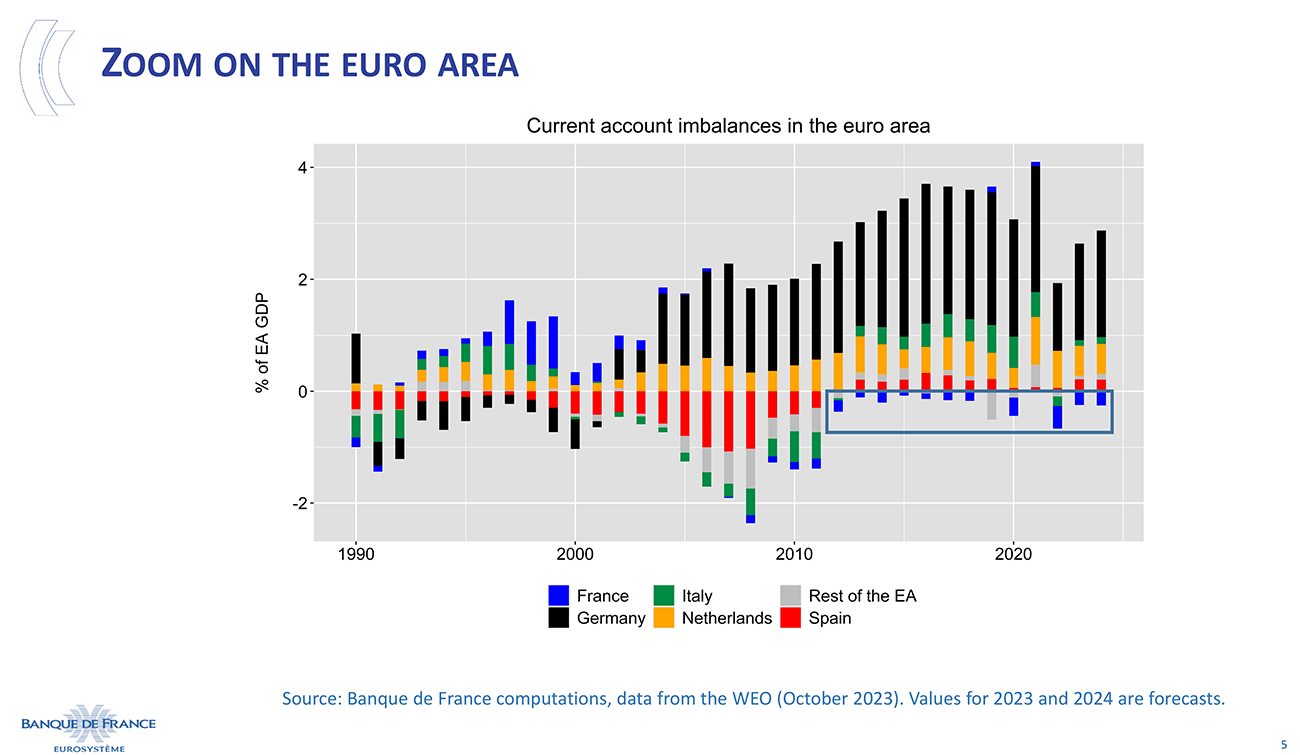
The euro area is an instructive illustration: current account imbalances increased before the Global Financial Crisis and decreased afterwards [slide 5]. Interestingly, Germany moved from a deficit in the 1990s to surplus in the 2000s and onwards, while France moved from surplus to deficit. More importantly, the euro area sovereign debt crisis triggered a quasi-elimination of the deficits disappear while the surpluses remained. After nearly ten years of aggregate current account surpluses in the euro area, the recent years show a moderate trend inflection with reduced current account surpluses while deficits also slightly widened.
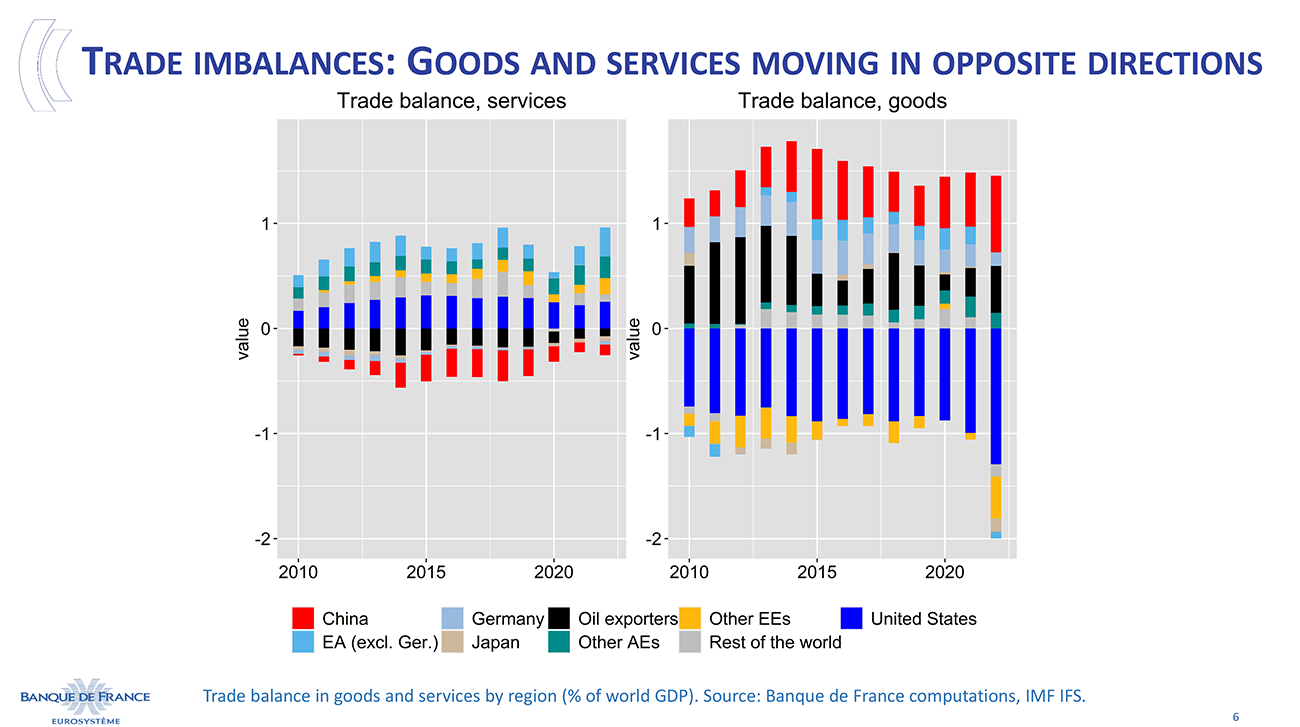
Another significant evolution is the development of trade in services. The two graphs on this slide [slide 6] show the trade balance in goods and services by region, in percentage of world GDP. It is striking that these two graphs are mirror images of each other: for instance, China runs a large trade surplus in goods but a deficit in services, while the US runs a large deficit in goods but a surplus in services. This inversion seems to be almost systematic, although the imbalances of services are smaller in percent of world GDP. However, since there is less trade in services than in goods, the ratio of these imbalances to international trade flows is larger: trade in services is more imbalanced than trade in goods.
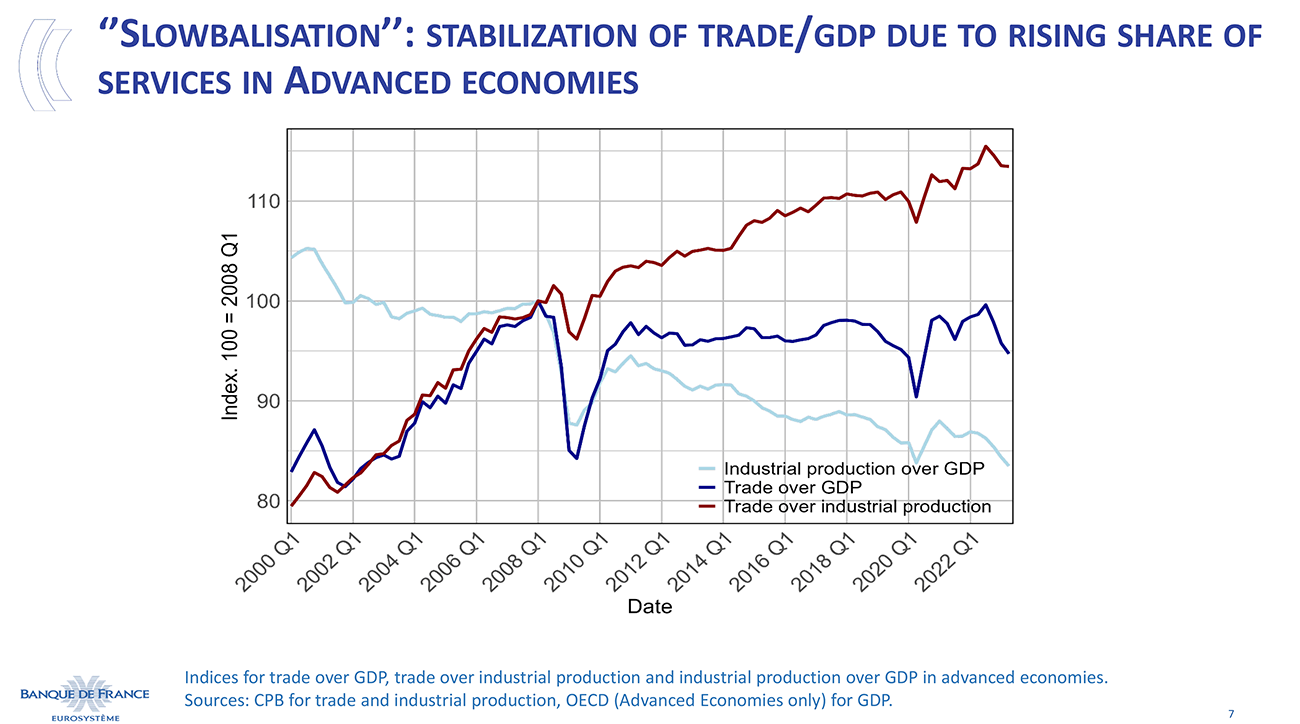
Although imbalanced itself, trade in services has contributed to reducing current-account imbalances since the GFC because the imbalances are in opposite sign compared to trade in goods, and because trade in services has continued to expand while the trade in goods was no longer growing faster than GDP [slide 7]. After the GFC, the ratio of trade to industrial production has continued growing, although slowly. The stabilization of trade to GDP is the flipside of the falling contribution of industrial production to GDP; the so-called “slowbalisation” can be explained by the rise of the share of services in GDP. Services are less traded internationally, which thus flattens the trade-to-GDP ratio.
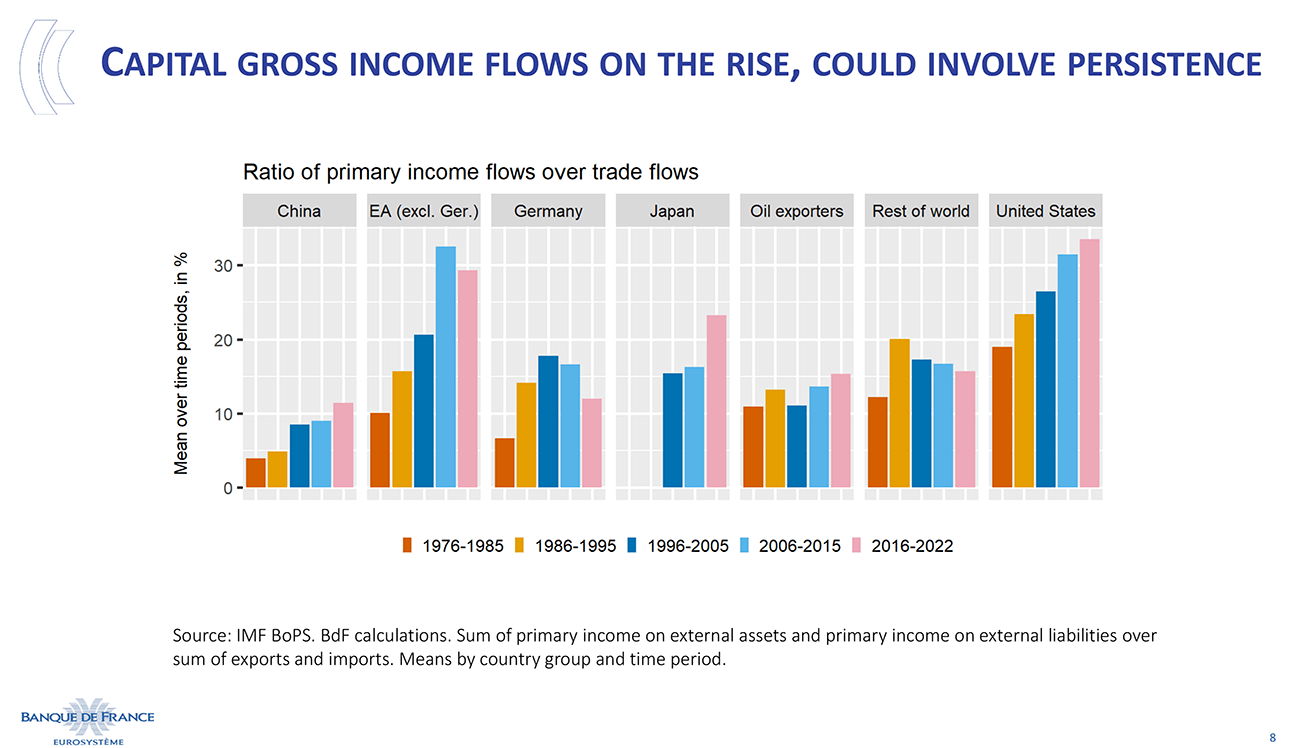
Another relevant dimension of global imbalances is the increase in capital income flows [slide 8]. The accumulation of imbalances eventually generates rising net investment positions. To the extent that the interest rate on external assets and liabilities is non-zero, the share of primary income flows to trade flows grows in terms of both gross and net capital income. The share of primary income grows faster than trade and this is increasingly affecting current accounts. This is even more relevant when interest rates start to increase as has been the case recently.
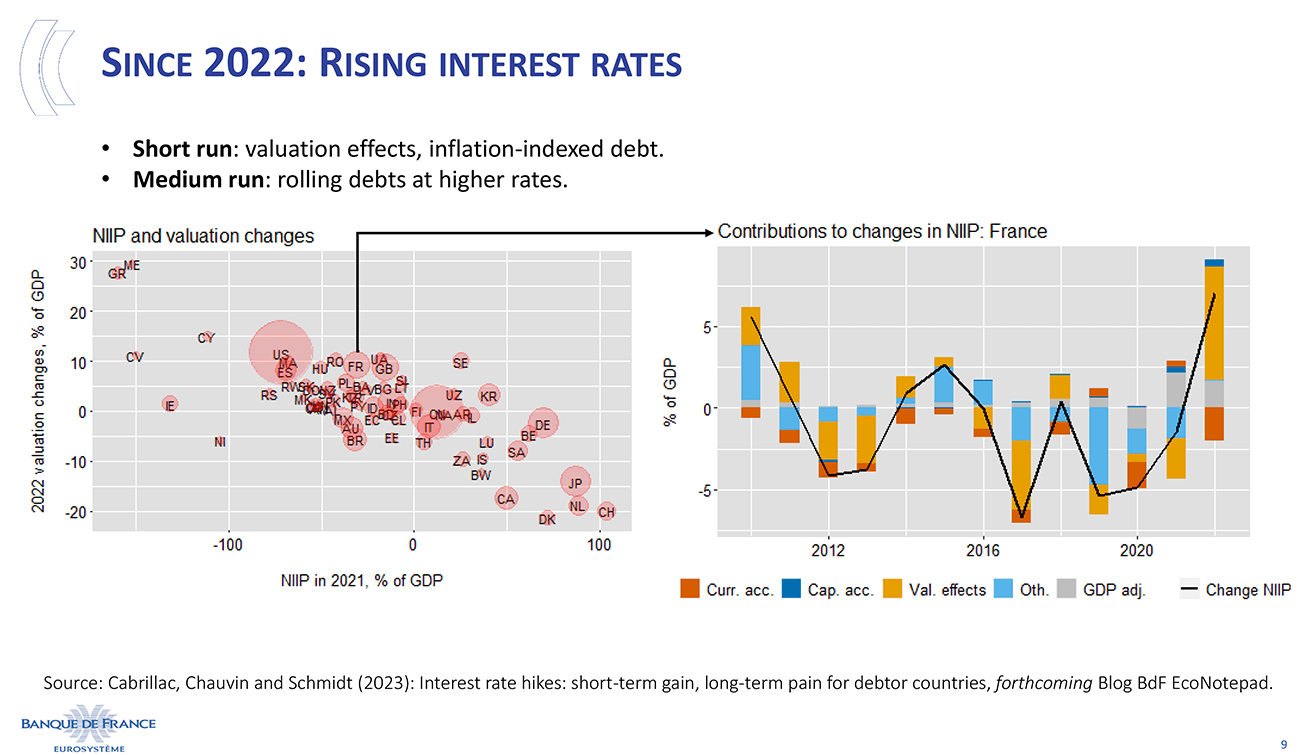
In the short term, the rise of interest rates affects the balance of payments essentially through capital gains, which are mostly unrealized. On the left-hand side of the slide [slide 9], the graph shows net international investment positions in percentage of GDP on the horizontal axis and so-called valuation effects on a vertical axis. For instance, China’s net international investment position stands at over 100% of GDP. Conversely, the US has a negative net investment position. The fall in the value of financial assets affects both countries’ external assets and liabilities, which means that countries with a positive net international investment position (like China) have lost from the valuation effect, whereas countries with a negative net position (like the US) have gained from it. In that sense, I would like to single out France, which had a negative position of around -30% of GDP in 2021. The right-hand graph shows that in 2022, France’s valuation effects increased the net international investment position by 7 percentage points of GDP – which is significant.
These capital gains are unrealized, but in the future, debt will have to be rolled over at higher interest rates, which will diminish the net international investment position. More generally, the accumulation of large international positions means that future evolutions of the latter will be increasingly influenced by financial conditions rather than price or non-price competitiveness.
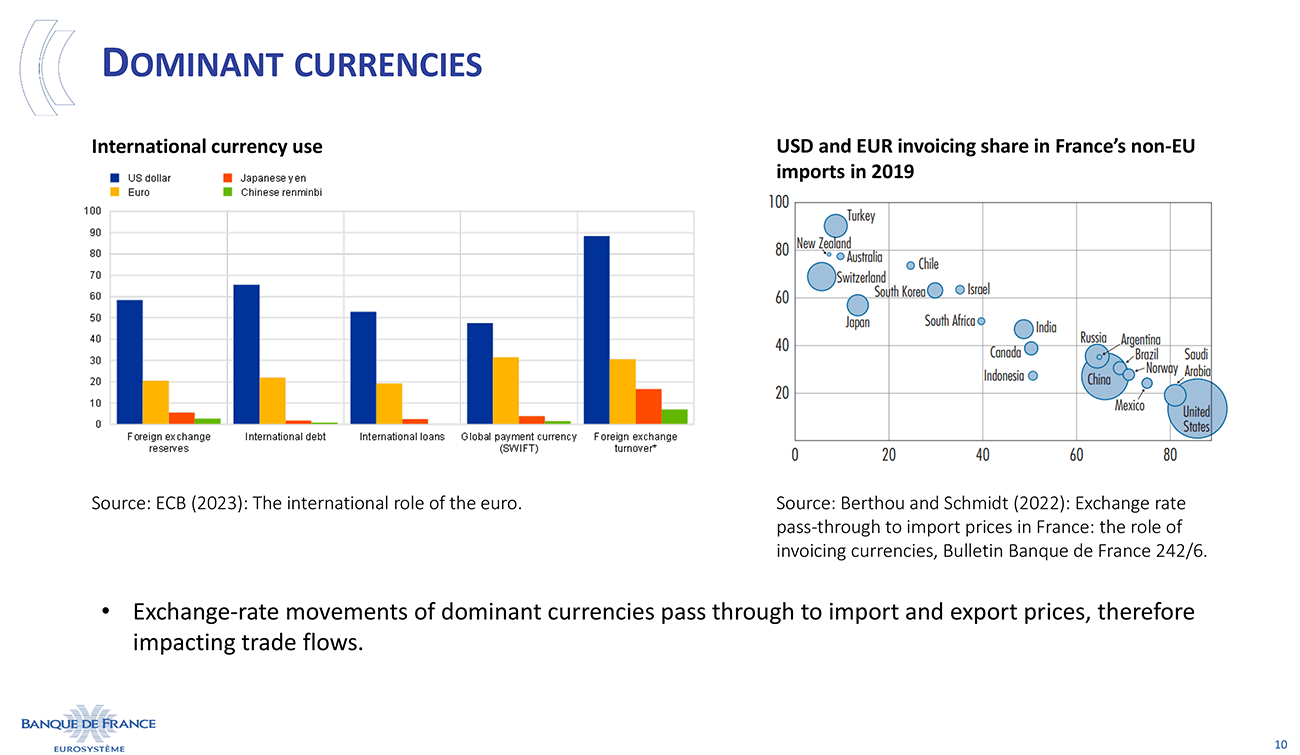
Finally, the issue of dominant currencies has already been explored extensively in the literature: balance sheets in foreign currency can potentially give rise to currency mismatches and trade invoicing in dominant currencies affects the international transmission of shocks [slide 10]. Consequently, the impact of exchange rate variation may be counterproductive in cases where an adverse shock hits the economy, or there can be a disconnect between bilateral exchange rates and terms of trade. In both cases, the stabilizing impact of the exchange rate is doubtful.
A multipolar monetary system may be stabilizing as it could involve more impactful exchange rate adjustments, but the way to reach such a system is still long.
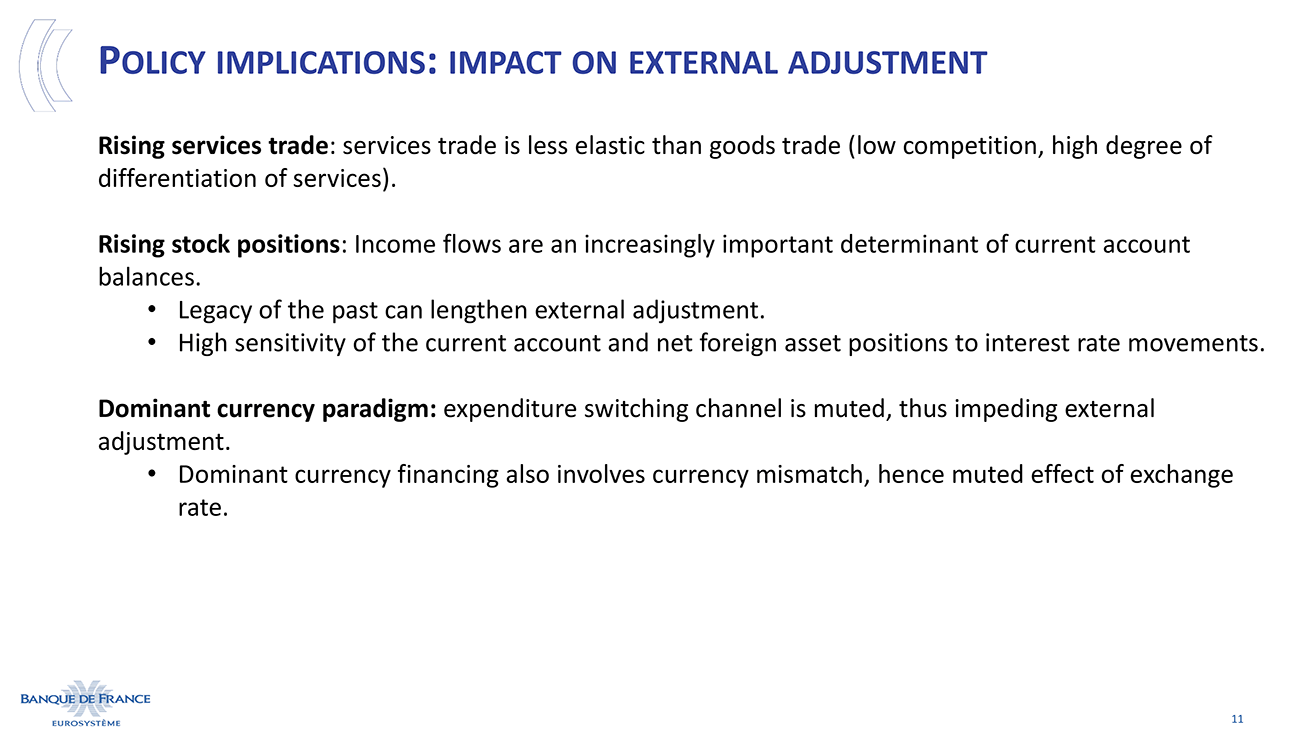
To wrap up the first part of my talk, three elements may weaken adjustments of current account imbalances [slide 11]. The first is the rise of services trade, which is less elastic to relative prices than trade in goods. Second, there is the rise in stock positions, which results in income flows being an increasingly important determinant of current account balances, with substantial inertia in relation to legacy assets and debts. Finally, the dominant currency paradigm means that expenditure-switching channels may be muted and slow down external adjustments.
Recent shocks to current accounts: Covid-19, and Russia’s invasion of Ukraine
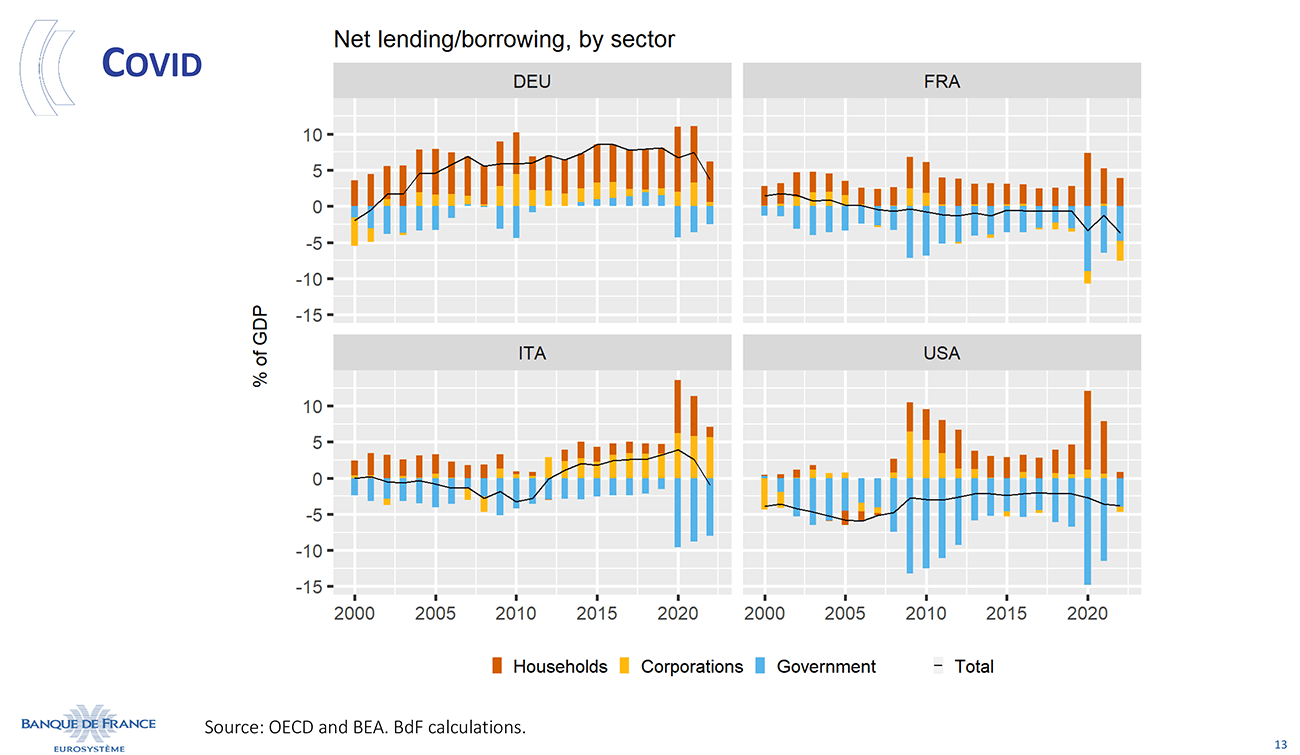
In recent years, the global economy has experienced a series of important shocks, among which COVID-19 [slide 13]. The repercussions of this pandemic have been diverse and complex. Primarily, we observed a surge in China's trade surplus, in relation to the supply of medical goods. Yet, the most dramatic consequence materialized in the evolution of net lending and borrowing across sectors, as for example shown in this slide for four countries. 2020 marked a distinct shift, characterized by an increase in government deficits and a simultaneous surge in net savings within the private sector. In recent years, the surge in energy prices had a significant impact, amplifying trade surpluses for exporters while weighing on importers. The key question is whether this trajectory is temporary or persistent — we will come back to this matter in the last part of this speech.
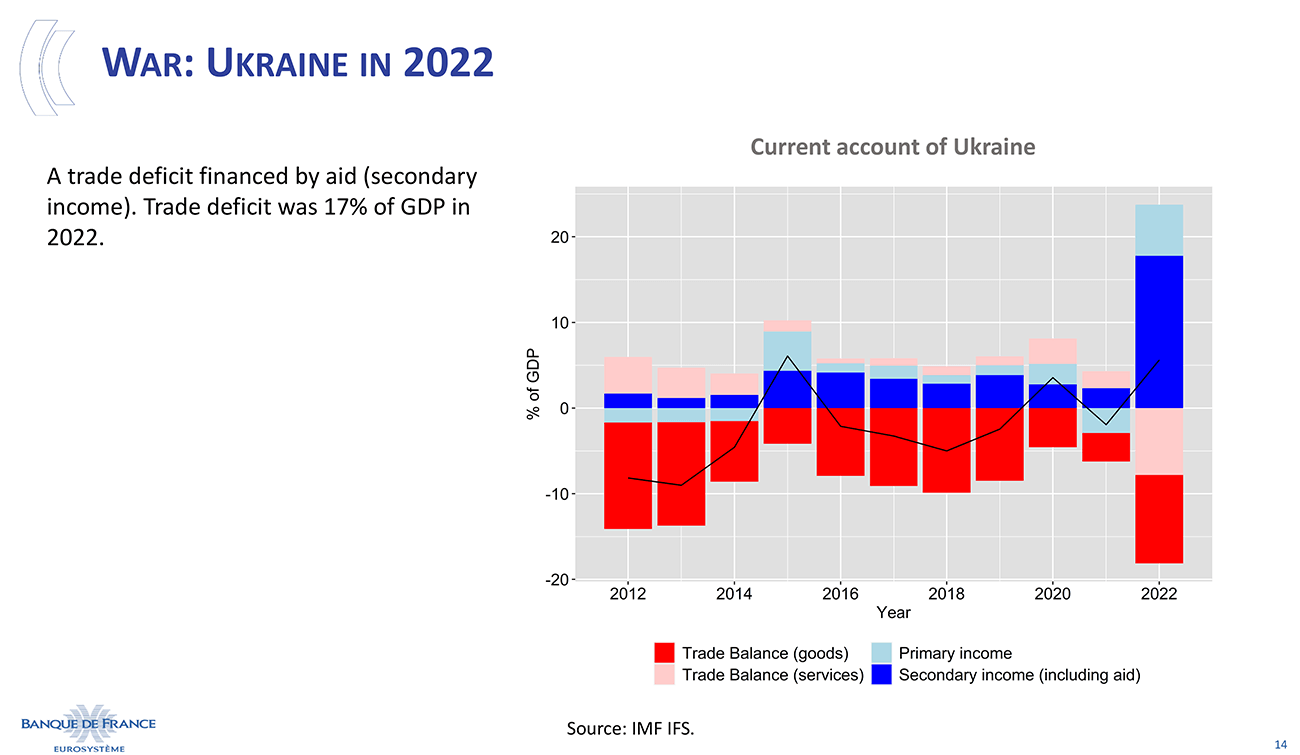
Another major shock in 2022 was Russia's invasion of Ukraine. The impact on Ukraine's current account is notable, as reflected in the chart [slide 14], measured as a percentage of Ukrainian GDP. Beyond the base effect, it is essential to acknowledge historical contexts where the influence of wars on current accounts depended on the support provided by allies. An illustration is found in France during World War I, where the trade deficit surged to 30% of GDP in 1917, fueled by resource imports from England, North America, and its colonies. In contrast, Germany sustained much smaller deficits, falling below 5% of GDP, as it had not received lending from allies. The paradoxical increase in Ukraine's current account in 2022, despite a substantial trade deficit, stems from secondary income, which mostly comprises foreign aid contributions.
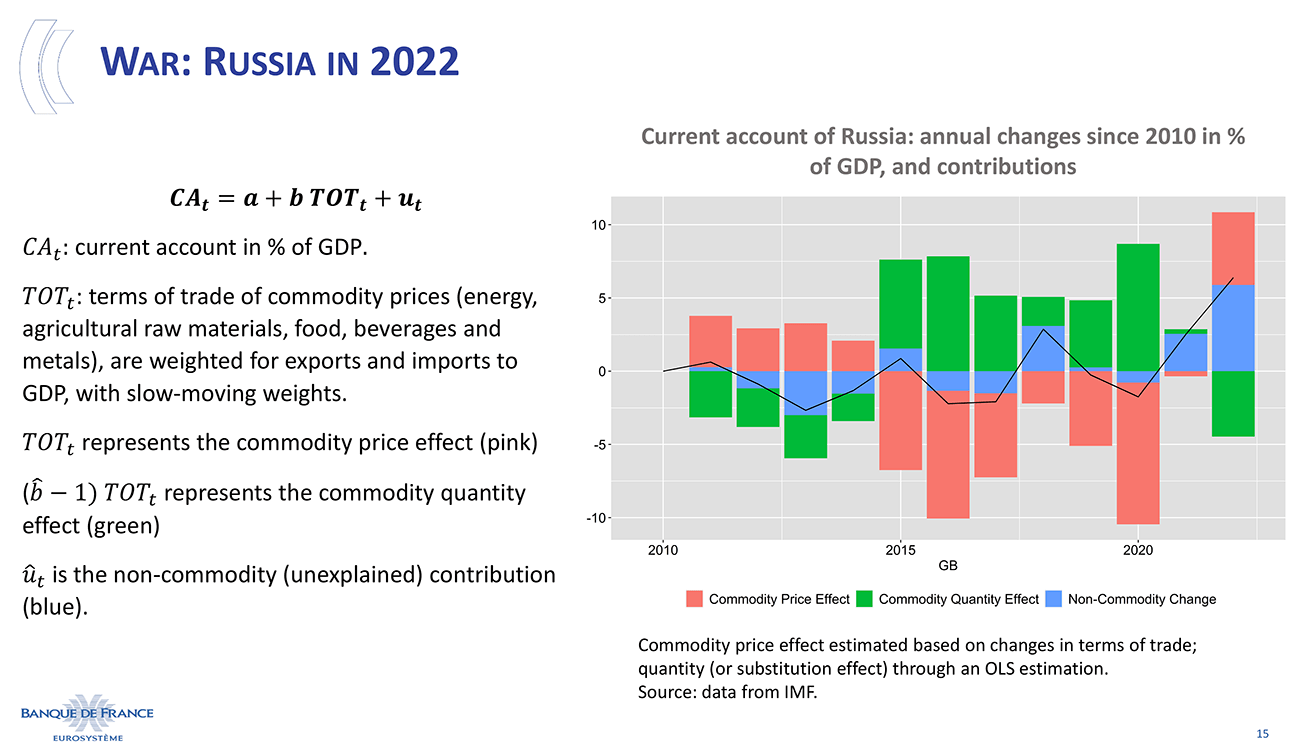
Turning our attention to Russia, we observe a notable increase in the current account surplus, stemming from mixed factors, among which the effect of the surge in gas and oil prices is associated with an adverse volume effect [slide 15]. Sanctions further influenced this dynamic, as our export restrictions to Russia translated into diminished imports, which had a positive impact on the current account. The increase in Russia’s current account does not inherently denote an increase of Russia's wealth; comprehensive insights on this matter can be found in the insightful works of scholars such as Oleg Itskhoki and Dmitry Mukhin.
So now, what’s next? Let me share with you some thoughts on what we call the greening of global imbalances.
The greening of global imbalances
To think about the evolution of current accounts in the coming years and decades, there are three groups of questions that need to be raised.
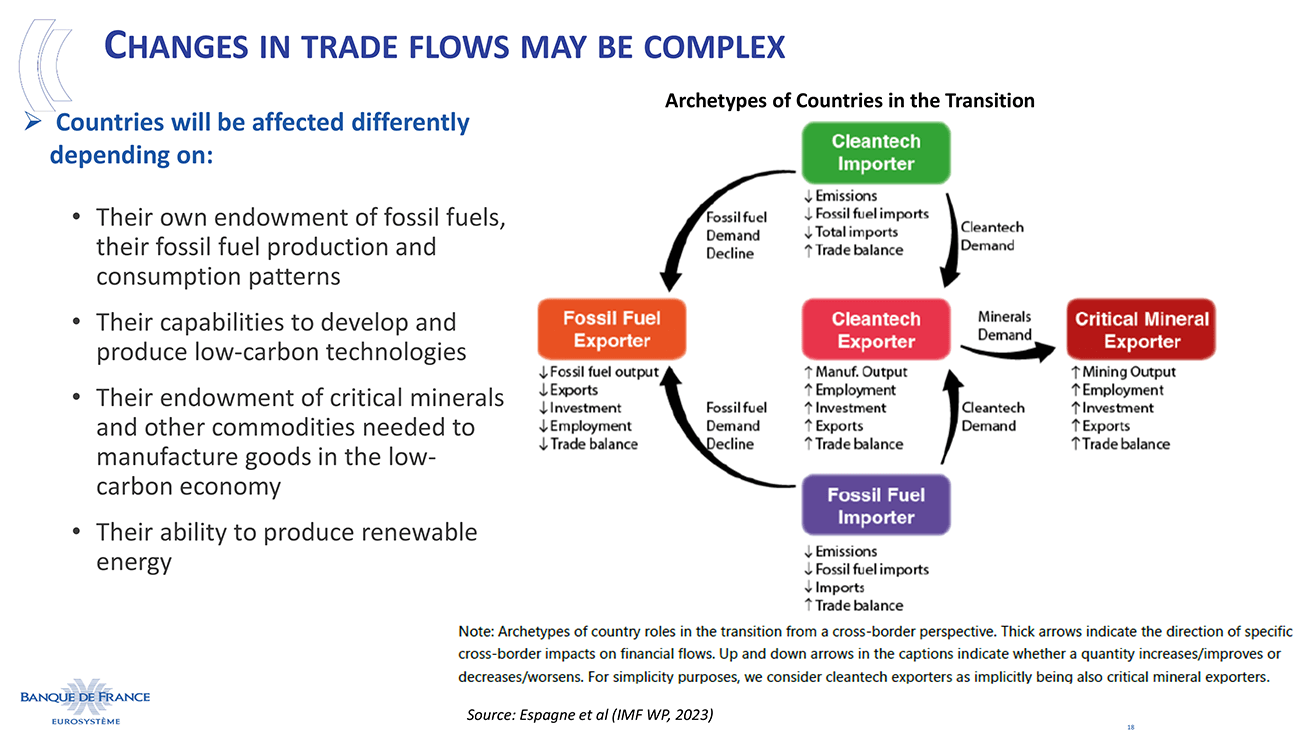
The first relates to the reallocation of trade flows across industries, anticipating shifts away from fossil fuel exports, a potential decline in long-distance tourism, and possibly a decrease in services necessitating face-to-face interactions. Meanwhile, trade of minerals, and of green and technological investment goods, are likely to expand.
The reallocation of trade flows will have consequential impacts on trade imbalances [slide 18]. For instance, the current account surplus from fossil fuel exporters is likely to diminish, with reduced deficit or increased surpluses for import-dependent nations. However, the final impact on imbalances is non-trivial given the multiplicity of trade reallocations. A comprehensive understanding requires general equilibrium models to capture the simultaneous evolution of interdependent quantity and price variables.
The second type of question delves into the reallocation of aggregate demands: will the reallocation of saving-investment imbalances triggered by the pandemic be long lasting? Will private savings increase, or will savings return to pre-COVID levels? Will there be a shift towards increased investment but reduced consumption during the green transition? We do not know the answers to these fundamental questions yet.
The third set of questions revolves around the relocation of saving and investment imbalances, both at the intra and international levels, depending on transition strategies. For instance, a nation's reliance on carbon pricing versus public investments could induce divergent impacts on current accounts. Besides, the allocation of savings from new current account-surplus countries will be key. Will their investment choices mirror those of traditional oil exporters, or will they adopt different capital allocation policies? Will “mineral dollars” or “green tech dollars” substitute for petrodollars?
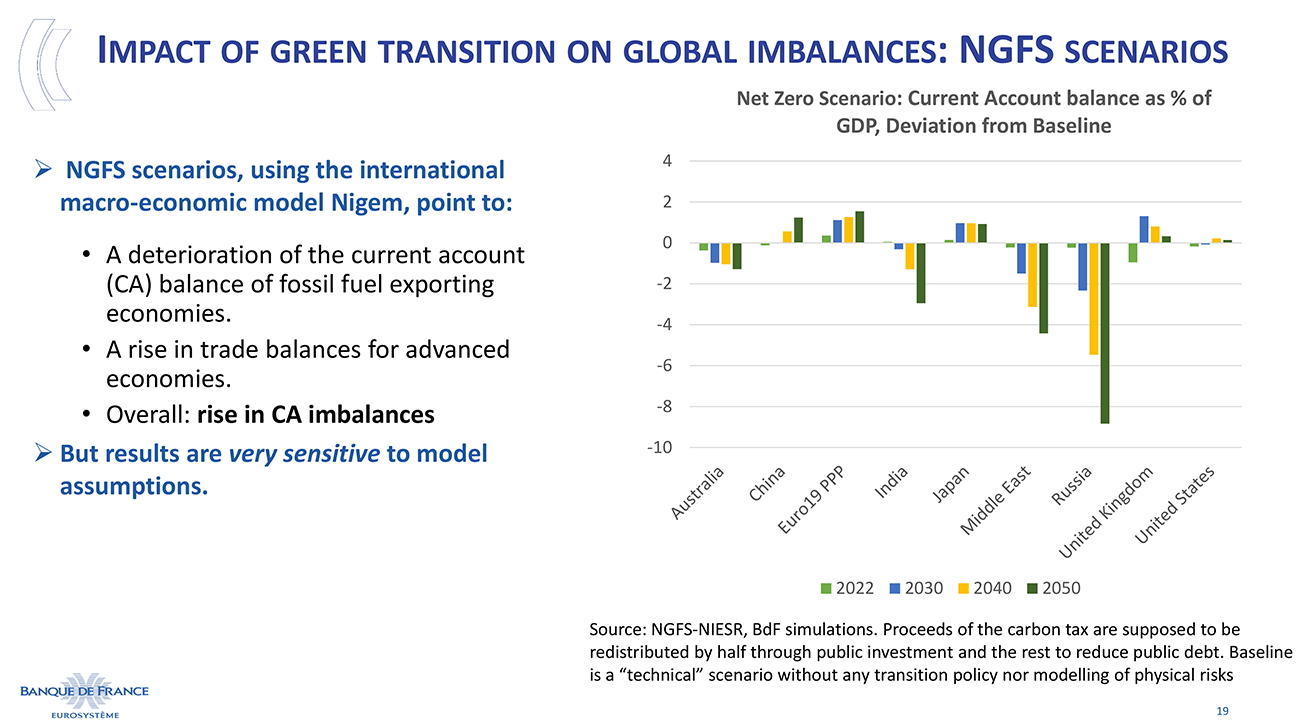
Several simulations using macroeconomic models have sought to assess the potential impact of the transition on GDP and employment, although less frequently in current account imbalances. The Network for Greening the Financial System (NGFS), whose secretariat is at the Banque de France, has published long-term net zero scenarios. Among these scenarios, the graph on this slide [slide 19] shows a net zero scenario that relies on a shadow carbon price and allocates carbon pricing proceeds evenly between public investment and the reduction of government debt. These simulations are based on the macroeconomic model NIGEM. The graph shows the deviations from a baseline, representing the current account as a percentage of GDP for each country or region. The baseline is a technical scenario devoid of any transition policy or physical risk, serving as a theoretical benchmark.
According to this simulation, the transition will reduce the current account surplus of oil-exporting nations, such as those in the Middle East and Russia, which could see a decrease of their current account balance to GDP of 6 pp in the case of Russia, and 3 pp for the Middle East in 2040. Conversely, the current-account surpluses of the euro area or Japan would increase slightly.
However, the results of these simulations are extremely dependent on the modality of the transition – here a carbon tax that results in reduced imports of carbon energies by European countries, potentially slowing down these economies, hence further slowing down their imports. Conversely, if the transition leans towards public investment and subsidies, it could stimulate imports, yielding the opposite effect.
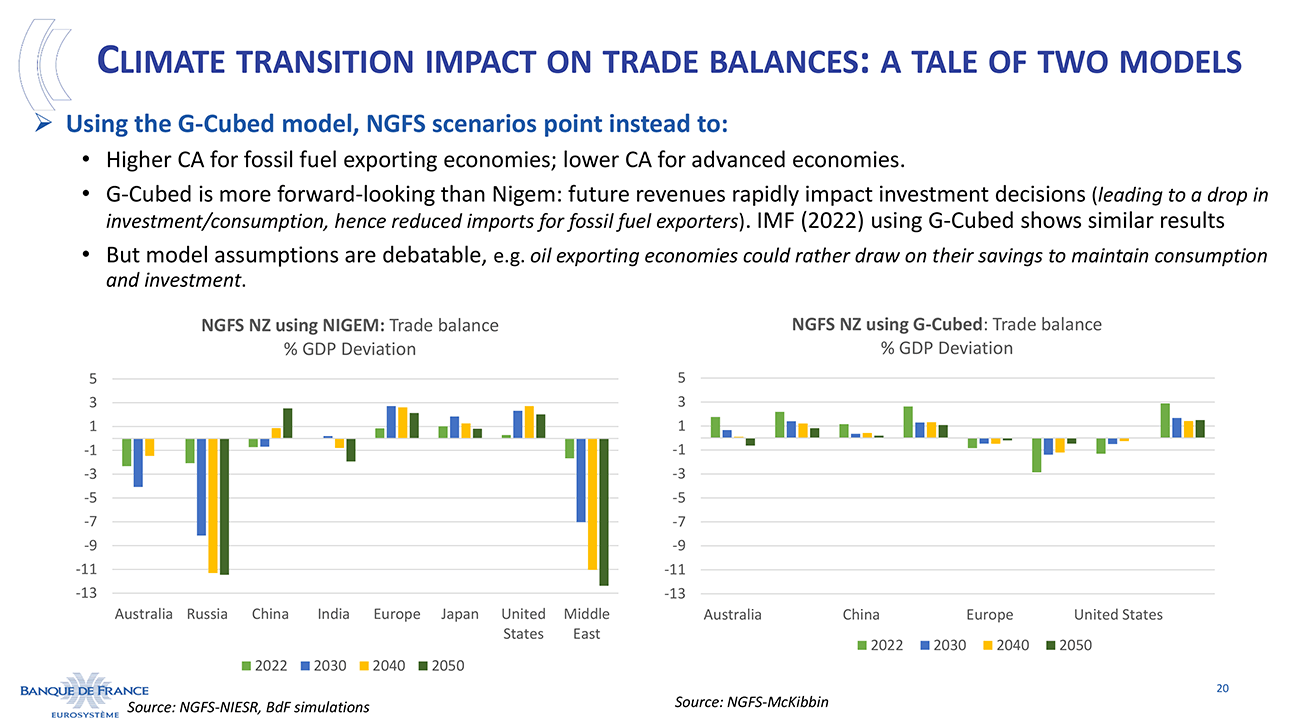
The choice of the model is also critical. The following slide [slide 20] shows a comparison of two distinct simulations based on the same scenario but with different models. On the left, NIGEM, similar to the preceding slide but representing a trade balance rather than the current account. On the right, G-cubed, a model characterized by more forward-looking behaviors and closer alignment with a DSGE model. Focusing on oil-exporting and producing countries, the NIGEM simulation of a net-zero scenario results in a contraction of the surpluses for Middle Eastern countries. Conversely, the G-cubed model depicts the same scenario leading to an expansion of the current account surplus.
For oil-exporting nations, it is logical to anticipate reduced revenues along the path to net zero. In a forward-looking model like G-Cubed, the immediate response is a proactive adjustment by consumers and investors, translating to a short-term surge in current accounts with reduced consumption and investment.
To what extent can we anticipate forward-looking behaviors in the short and medium term? This question carries significant implications for policymakers [slide 21]. Relying solely on ex-ante modeling may prove insufficient, and we need to identify proxies that can effectively assess the impact of macro shocks similar to climate or transition-related shocks, be they associated with productivity, cost structures, etc. The progress made in macro-modeling over the past five years has been significant, but the next step is to find a clear answer to these very key questions.
The modeling capacity regarding the impact of the green transition on macroeconomic variables has undergone a very significant upgrade in recent years. Nevertheless, a series of fundamental questions are still unresolved, and we should stay attentive to possible divergence among countries or regions following different pathways in the transition process. The synergy of macro modeling and econometric evidence will be key for advancing our understanding and informing effective policy-makers. We hope that CEPR scholars will provide insightful answers to these crucial questions.
Thank you very much for your attention.
Updated on the 25th of July 2024