GDP-linked bonds sound enticing…
During the Great Recession and the recent pandemic, general government debt-to-GDP ratios in advanced economies increased considerably, from 71% in 2007 to 122% in 2021. Such large debt-to-GDP ratios may prove to be a source of vulnerability, which can amplify macroeconomic and financial shocks and thus increase the likelihood of a decline in economic activity.
Discussions in policy and academic circles (Borensztein and Mauro, 2004; Blanchard, Mauro and Acalin, 2016) suggest that indexing the debt service (coupons and face value) to nominal GDP would reduce the severity of such an event by providing the government with an automatic stabilizer for its financing. By issuing GDP-linked bonds, the government’s debt-service burden is higher in periods of strong economic growth, while payments are reduced in periods of economic downturn. In other words, if all of a country’s public debt service were indexed to GDP – similarly to inflation-linked bonds that index all payments to realized inflation – one would expect the debt-to-GDP ratio to be hedged against unforeseen changes in GDP growth.
Some attempts to issue similar instruments have been made in the context of debt restructuring, including in Costa Rica in 1990, Bulgaria in 1993, Bosnia and Herzegovina in 1997, and more recently, Argentina, Ukraine and Greece (Cabrillac et al., 2018). However, their design did not provide symmetrical payoffs. In other words, they promised larger payoffs if certain growth levels or milestones were met, but not lower payoffs if the economy of the issuing government fell into recession. Yet, it is this very symmetry that is at the heart of the recent GDP-linked bond proposals.
Based on this rationale, it is surprising that such promising debt-stabilizing instruments have not been issued by an advanced economy on a large scale.
…however they include sizable and countercyclical risk premia…
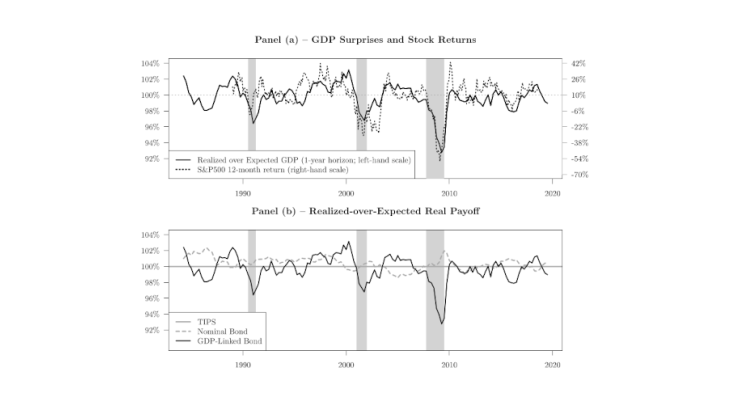
Unlike corporations that can obtain external financing via debt and equity, governments solely rely on debt. With their payoffs co-moving with economic performance, GDP-linked bonds would share similar characteristics to those of equity. Indeed, Panel (a) of Chart 1 shows that GDP surprises –measured by the ratio of realized-to-expected payoffs– are highly correlated with the returns of the S&P500, and thus procyclical. Panel (b) of the same chart shows that the payoffs of conventional bonds (standard nominal and inflation-linked bonds) are far less in sync with the business cycle and weakly correlated with stock returns.
By taking a macro-finance model to the data, Mouabbi, Renne and Sahuc (2021) show that GDP-linked bond prices would embed sizable and countercyclical risk premia. These premia are estimated to be about 40 basis points. This would inflate the interest rate at which the government borrows, as investors require an additional compensation for being exposed to GDP risk.
Given the inverse relationship between bond prices and their associated interest rates, it would require a larger issuance of GDP-linked bonds, relative to conventional bonds, to raise a particular amount. In other words, issuing GDP-linked bonds is on average costlier.
…and display weak debt-stabilizing properties in the long run
Despite the higher cost of indexing debt to GDP, this strategy may still be more beneficial to the government by facilitating debt stabilisation, which can prevent further amplifications of adverse shocks.
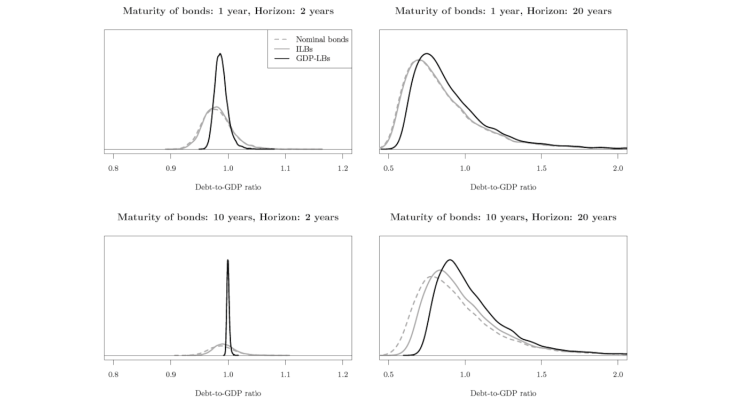
In order to assess whether stable debt levels can be achieved, Mouabbi, Renne and Sahuc (2021) estimate a consumption-based asset-pricing model with external habits to price GDP-linked bonds and simulate debt-to-GDP trajectories in a setup where the government issues bonds that differ along two dimensions: type (nominal, inflation-linked and GDP-linked bonds) and maturity (1 year and 10 years). They find that debt-to-GDP ratios are, on average, higher when the government issues GDP-linked bonds. Interestingly, the variance of the distribution of debt-to-GDP ratios is far lower at a 2-year horizon (Chart 2).
This increased predictability is welcomed by the government as it facilitates its debt management. Specifically, for short- to medium-run horizons, a government would have foresight on future debt-to-GDP ratios, facilitating the management of its fiscal policies (taxes and expenditures) at such horizons. In contrast, the distributions at a 20-year horizon are dispersed and shifted to the right. This means that GDP-linked bonds are unable to prevent high debt-to-GDP ratios in the long run (which is the relevant horizon for public debt strategies). This decrease in predictability is driven by the fact that, as the horizon strategy increases, a larger proportion of debt would need to be rolled over, exposing the government to future interest-rate fluctuations.
These findings call into question the view that GDP-linked bonds tame debt.

