Eco Notepad

Despite inflation, Europeans are still holding on to their banknote reserves

Published on 18 December 2023
Authors : Lucas Devigne, Victor Michel, Raymond De Pastor, Johan Tricot

Post n°334. For 20 years, the euro area experienced low inflation and low interest rates, which may have encouraged economic agents to accumulate banknotes, sometimes on a massive scale. The resurgence of inflation in 2021-22 and increase in ECB key rates have changed this environment. Yet, when we take into account the massive reduction in German and Austrian banks’ cash stocks, euro area households do not appear to be have been returning their banknotes.

Image Chart 1: Monthly stock of euro area banknotes in circulation (EUR billions and year-on-year change)
Source: ECB.

“Cumulative net issuance” of euro area banknotes refers to the stock of banknotes in circulation issued by Eurosystem national central banks (NCBs) since the introduction of the euro. It is the difference between total outflows (withdrawals) and total inflows (lodgements) of banknotes since 2002, i.e. “net issuance”. Cumulative net issuance (CNI), which hence corresponds to the total stock of cash held by the various economic agents (households, commercial banks, firms, non-Eurosystem agents), increased steadily up to mid-2022 (see Chart 1). 


From 2008 to mid-2022, CNI of euro banknotes rose at a rate of around 6% per year. There were occasional accelerations, corresponding to periods of strong economic uncertainty: the subprime crisis, the Russian rouble crisis (which mainly affected Germany and eastern euro area countries) and, more recently, the Covid crisis and the outbreak of the war in Ukraine (which had more localised, one-off impacts, e.g. in the Baltic countries). However, from July 2022 onwards, CNI fell each month, and on an unprecedented scale, before stabilising in the winter of 2022/23. This decline means that more banknotes were being returned to NCBs than were being withdrawn, and coincides with the rise in European Central Bank (ECB) key interest rates. 

Cash hoarding by households: strong demand for banknotes 

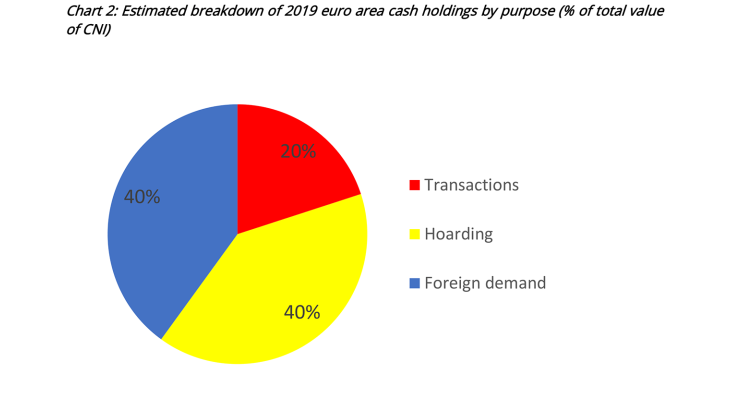
Hoarding is defined here as the accumulation and holding of cash by economic agents, either at home or in safety deposit boxes. It therefore differs from the broader definition, which is the accumulation of wealth with no intention to either spend or invest it. Recent studies have estimated the share of banknotes in circulation that are hoarded by economic agents. In the euro area it stands at around 40% (see Chart 2), while in non-euro area countries the share is also estimated to be 40%. In the euro area, only 20% of these banknotes are thought to be held for use in day-to-day transactions or payments. 
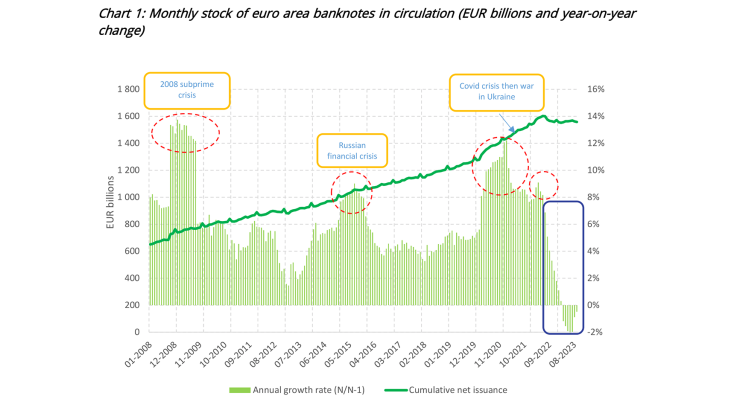
Image Chart 2: Estimated breakdown of 2019 euro area cash holdings by purpose (% of total value of CNI)
Sources : Lalouette, L. et al. (2021), Zamora-Pérez, A. (2021)

Is the 2022-23 inflation and interest rate environment encouraging households to get rid of their banknote holdings?

A massive reduction in banknote holdings stemming from German and Austrian banks

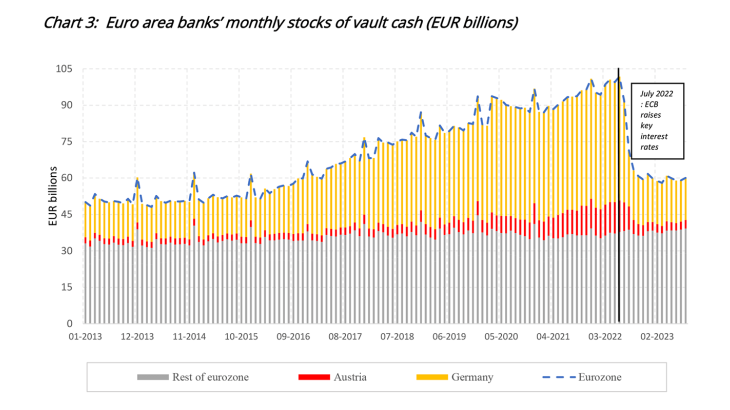
Commercial banks keep stocks of banknotes (vault cash) to meet the needs of their customers (replenishment of ATMs, shops, etc.). However, in the euro area, vault cash fell sharply in July 2022 and continued to decline throughout the second half of the year (see Chart 3). As a result, large quantities of banknotes were returned to NCBs, contributing to the decline in CNI. The trend is attributable to German and Austrian banks, which, since 2016, had built up substantial cash reserves (in large denomination banknotes) to avoid being hit by the negative deposit facility rates introduced over the period (2016-22). They were helped by the fact that they have large amounts of available vault space, reflecting the strong preference for paying in cash in these countries (see recent publication by Deutsche Bank). No similar trend can be observed in other euro area countries.  

Image Chart 3:  Euro area banks’ monthly stocks of vault cash (EUR billions)
Sources: ECB, Deutsche Bundesbank, Oesterreichische Nationalbank

A correction in banknote net shipments to non-euro area countries

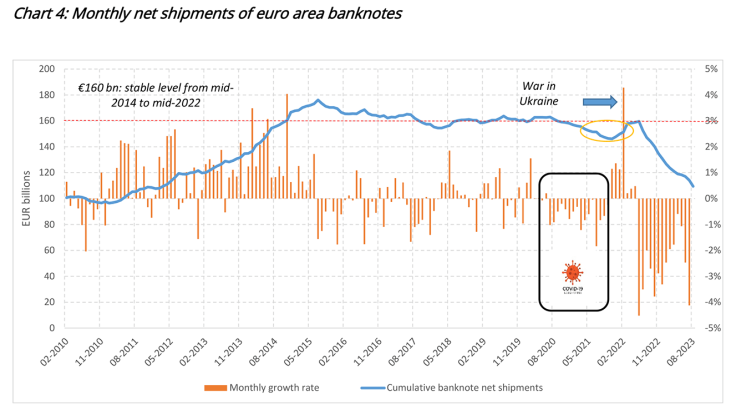
Regarding foreign demand for euro area banknotes, an analysis of flows between euro area and non-euro area countries (which only partially corresponds to real foreign demand; for example, tourism-related flows are excluded) shows that foreign banknote holdings increased up to 2015, and have since stabilised at around EUR 160 billion (see Chart 4). They declined slightly during the Covid crisis (suspension of transport links), but rose again in the first half of 2022 with the start of the war in Ukraine, coming back to EUR 160 billion. From the summer of 2022, however, foreign holdings dropped sharply. Unlike the correction observed for banks, which finished at the end of 2022, this decline has continued throughout 2023 (EUR 110 billion in July). 

Image Chart 4: Monthly net shipments of euro area banknotes
Source: ECB.

Clearly, the majority of the decline in banknotes in circulation since summer 2022 stems from the measures taken by German and Austrian banks in the second half of 2022, and the fall in net shipments to non-euro area countries, which is still ongoing. In contrast, no significant return of household banknote holdings can be observed.

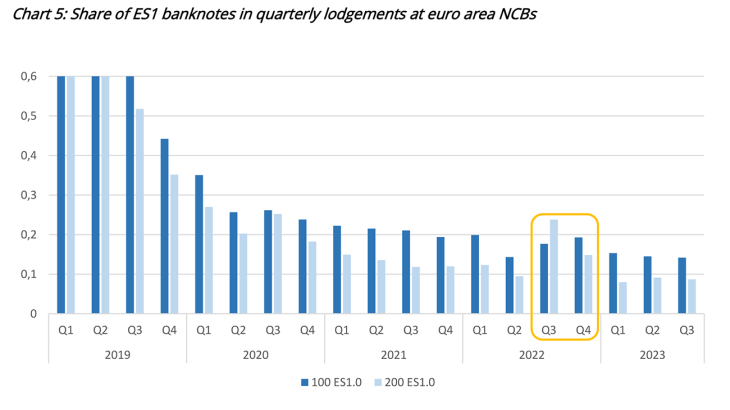
This latter point is confirmed by a separate analysis. In 2013, the Eurosystem decided to replace its first series of euro banknotes (ES1) with a second series (ES2). The switch took place gradually, from 2013 to 2019, depending on the denomination. If households had returned significant quantities of banknotes in 2022-23, the Banque de France would have found a higher than usual share of ES1 banknotes in its lodgements.

Chart 5 shows that there was a slight rise in inflows, but only of higher denomination ES1 banknotes (€100-€200), and that this was limited to the second half of 2022 and linked to the return of banknotes held by German and Austrian banks. The situation then returned to normal as of January 2023.

Image Chart 5: Share of ES1 banknotes in quarterly lodgements at euro area NCBs
Sources: ECB, authors’ calculations.
Note: Above 60%, the ratio is equal to 100%; it has been capped at 60% to make the chart easier to read.

Download the PDF version of the publication